Principal stock forecast 2027–2029
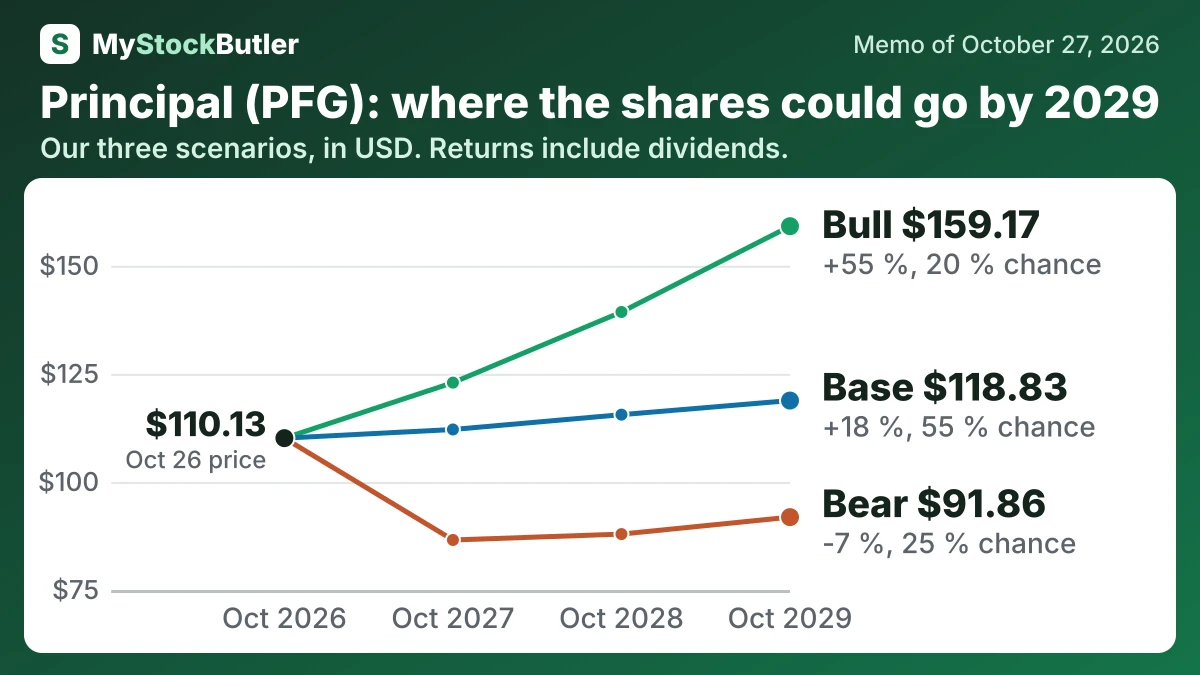
MyStockButler's October 2026 analysis: Principal's weighted price is $107.91 in October 2027 and $120.15 in October 2029; the bear case carries 25%, the base case carries 55%, and the bull case carries 20%. Principal's forecast hinges on earnings, flows and capital access supporting the case.
Where could Principal's shares be in each forecast year?
The weighted price is $107.91 in October 2027, implying a 1% return. It reaches $120.15 in October 2029, implying a 19% return. The bear case carries 25%. The base case carries 55%. The bull case carries 20%.
| Case | Probability | October 2027 | October 2028 | October 2029 |
|---|---|---|---|---|
| Bear | 25 % | 86.57 (-18 %) | 87.94 (-14 %) | 91.86 (-7 %) |
| Base | 55 % | 112.14 (+5 %) | 115.57 (+11 %) | 118.83 (+18 %) |
| Bull | 20 % | 122.98 (+15 %) | 139.32 (+33 %) | 159.17 (+55 %) |
| Weighted | 100 % | 107.91 (+1 %) | 113.41 (+9 %) | 120.15 (+19 %) |
What has to go right, and what could go wrong for Principal?
The base path assumes earnings remain strong enough to offset dividends and repurchases. Operating earnings were $1,865.5 million in 2025 and $1,484.9 million in the first nine months of 2026. The bear path includes a $1.5 billion market or reserve shock, consistent with the disclosed sensitivity to interest rates. The bull path requires stronger earnings, resilient benefits margins and better fee results.
How much cash does Principal really make, and what does it give back?
Principal received $1,793.1 million of subsidiary dividends and returns of capital in 2025. That cash supports debt service and shareholder payments, but future transfers depend on subsidiary earnings and legal restrictions. Book value therefore needs to be read beside statutory capital, parent liquidity and distribution capacity.
Operating cash flow was $4,536.7 million in 2025, while investing activities used $4,135.8 million. Buying bonds to support future benefits is not the same as discretionary expansion spending. The useful question is whether capital generation, subsidiary distributions and parent cash can support obligations together.
| 2025 | 2024 | 2023 | 2022 | 2021 | |
|---|---|---|---|---|---|
| Cash and short-term investments (calculated) | 4,431.0 | 4,211.9 | 4,707.7 | 4,848.0 | 2,332.0 |
| Total assets | 341,376.5 | 313,663.6 | 305,046.7 | 290,867.0 | 305,099.0 |
| Total debt (calculated) | 3,996.6 | 4,177.0 | 4,066.8 | 4,160.7 | 4,454.8 |
What this means. Total debt does not include operating leases or money owed to policyholders, so it is not every obligation the company has.
What does an investor pay today for Principal?
A 12.3x operating P/E means investors pay $12.30 for each dollar of annual operating earnings. It is a price comparison, not a 12.3% return: the earnings remain inside the company unless management distributes them. The 11.7x forward P/E instead uses expected earnings for the next twelve months. Dividing the share price by the operating multiple implies about $8.95 of operating earnings per share.
| Today (Oct 27, 2026) | |
|---|---|
| Share price | 110.13 |
| Market value (every class) (calculated) | 23,435.664 |
| Price to book (calculated) | 2.0x |
| P/E on operating earnings, last 12 months (calculated) | 12.3x |
| P/E, next 12 months (calculated) | 11.7x |
| Dividend yield (calculated) | 3.1% |
What this means. The next twelve months' price-to-earnings ratio uses analysts' guesses about future profit, so it is not guaranteed.