Norfolk Southern dividend: payout and coverage
MyStockButler's October 2026 analysis: Norfolk Southern pays $5.40 annually, or $1.35 quarterly. In 2025, its free cash flow was $2,157M against $1,215M of dividends.
How much does Norfolk Southern pay in dividends?
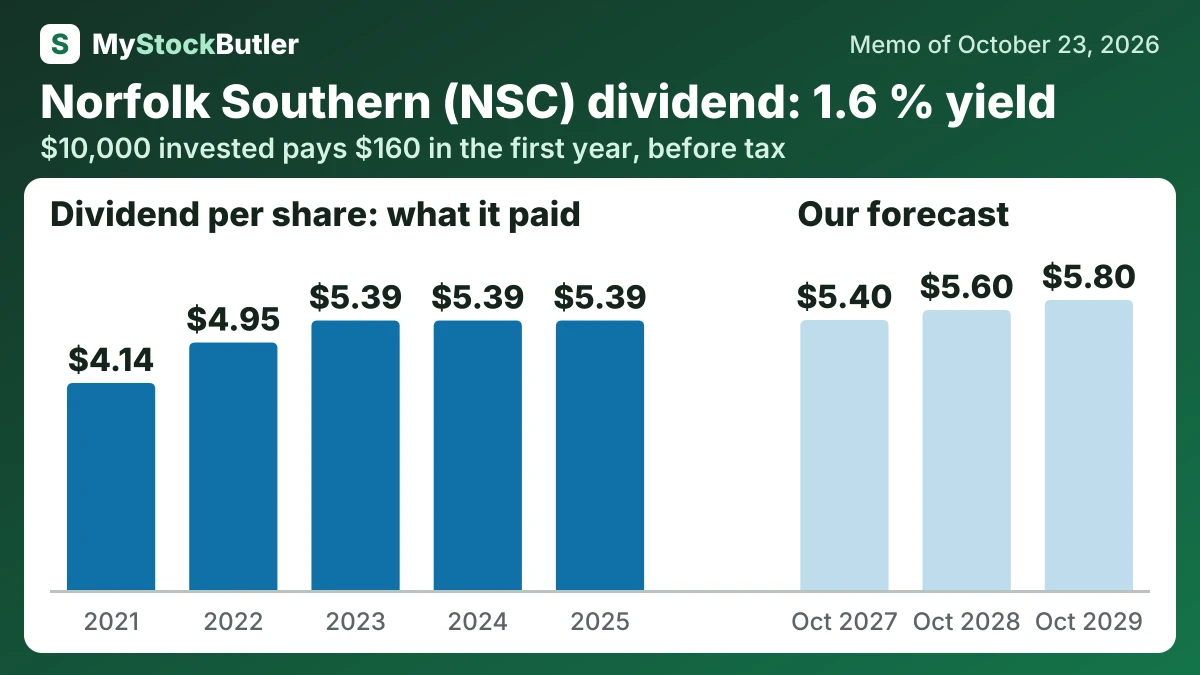
The dividend starts from the current $1.35 quarterly rate, or $5.40 annually. It has stayed at $5.40 since 2023, although 2025 free cash flow was $2,157M against $1,215M of dividends. The base path therefore uses $5.40, $5.60 and $5.80. The bear case holds $5.40 throughout. The bull case uses $5.60, $5.90 and $6.20 if earnings and cash conversion restart dividend growth.
| 2025 | 2024 | 2023 | 2022 | 2021 | |
|---|---|---|---|---|---|
| Free cash flow per share | 9.57 | 0.12 | 3.65 | 9.65 | 11.23 |
| − Dividends paid, per share | 5.39 | 5.39 | 5.39 | 4.95 | 4.14 |
| = FCF not paid out, per share | 1.81 | ||||
| = Paid out more than FCF, per share | 5.27 | 4.47 | 8.50 | 6.58 |
How much would Norfolk Southern's dividend pay you?
$10,000 invested in Norfolk Southern at its 1.6% dividend yield (our report of October 23, 2026) pays $160.00 in the first year, before tax. If its dividend per share keeps changing 6.8% a year, as it did from 2021 to 2025, and the dividends are reinvested, year 10 pays $349.68, with $2,420.08 received in all.
Before tax. Past dividend growth is not a promise. Information only, not investment advice.
Does Norfolk Southern's dividend come from free cash flow?
Free cash flow is the cash left after operating expenses and property additions. In 2025, operations generated $4.4 billion and property additions used $2.2 billion. Dividends and buybacks then claimed cash that could otherwise have reduced debt, funded projects or remained available for surprises.
NS bridged that gap through borrowing, asset sales and cash already on hand. Net debt rose from $13.0 billion at the end of 2021 to $15.6 billion at the end of 2025. That does not mean every borrowed dollar funded a dividend, but it does show that distributions were not fully supported by internally generated surplus.
| 2025 | 2024 | 2023 | 2022 | 2021 | |
|---|---|---|---|---|---|
| Free cash flow | 2,157 | 28 | 830 | 2,274 | 2,785 |
| − Dividends paid | 1,215 | 1,221 | 1,225 | 1,167 | 1,028 |
| − Share buybacks | 534 | 0 | 622 | 3,110 | 3,390 |
| = Free cash flow not paid out | 408 | ||||
| = Paid out more than the free cash flow | 1,193 | 1,017 | 2,003 | 1,633 |
What this means. In 2024, the company paid shareholders far more than the cash its business made, using savings or borrowing; the very high percentage is mainly because free cash flow was only 28 million.
What could change Norfolk Southern's dividend?
A worsening operating ratio, further fuel pressure or service metrics below prior-year levels would move it toward the bear case. Claims that remain unresolved, capex above plan or capacity that fails to attract profitable shipments would also weaken cash flow and valuation.
| October 2027 | October 2028 | October 2029 | |
|---|---|---|---|
| EBITDA | 6,100 (5,350 / 6,500) | 6,500 (5,500 / 7,200) | 6,850 (5,750 / 7,800) |
| Dividends per share | 5.40 (5.40 / 5.60) | 5.60 (5.40 / 5.90) | 5.80 (5.40 / 6.20) |
| Net debt | 13,999 (14,815 / 13,755) | 12,738 (14,315 / 12,275) | 11,343 (13,615 / 10,515) |
What is Norfolk Southern's dividend yield today?
P/E, or price-to-earnings, compares the share price with annual profit per share. The trailing multiple uses the last twelve months; the forward multiple uses the next twelve months. NSC’s figures imply earnings of about $11.91 and $14.33 per share, so the lower forward multiple assumes earnings will rise. It does not prove that the shares are cheap. Its modest free-cash-flow and dividend yields likewise leave much of the case resting on future improvement.