NRG dividend history and cash coverage
MyStockButler's October 2026 analysis: NRG pays an annualized $1.90 per share, and dividends rose each year over the supplied history. Cash coverage is mixed: shareholder payments were much larger than free cash flow across the period, while projected free cash flow of $2.8 billion–$3.3 billion is before growth investments.
How much does NRG pay its shareholders?
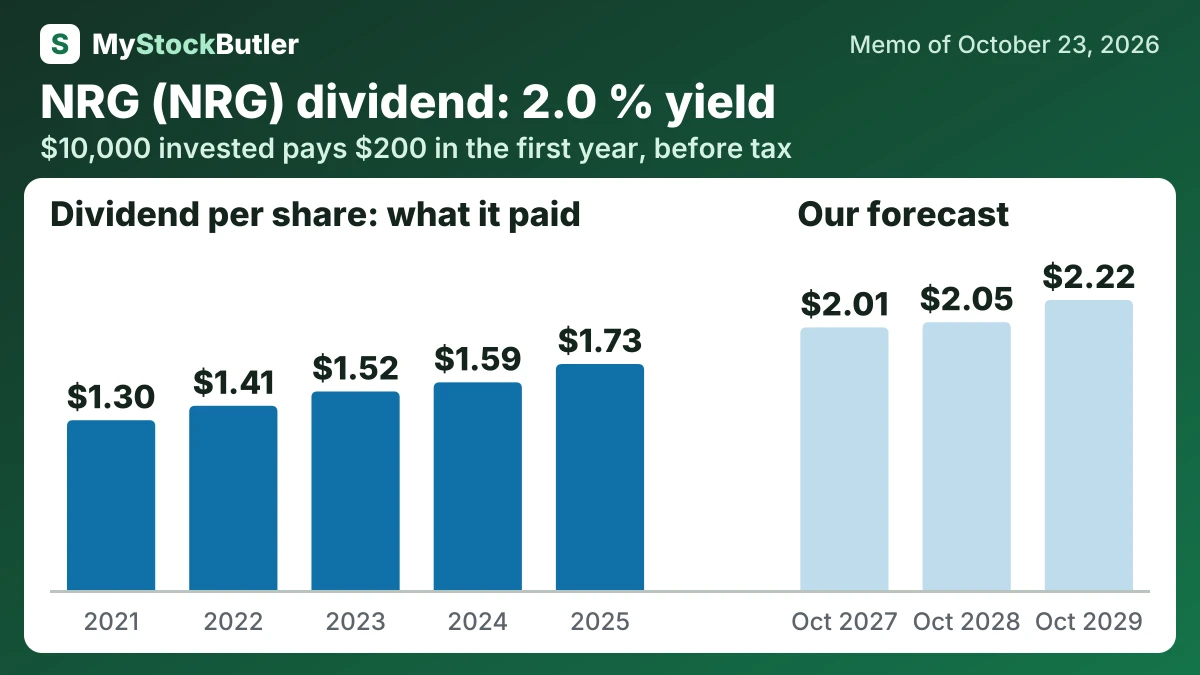
Base dividends per share are $2.01 after one year and $2.22 after three. The latest annualized rate is $1.90, and dividends rose each year over the supplied history. The base uses the midpoint of management’s growth target. The bear case cuts the payout to $1.71; the bull case reaches $2.26 if cash conversion remains strong. Project spending and debt make the cut credible despite the record.
| 2025 | 2024 | 2023 | 2022 | 2021 | |
|---|---|---|---|---|---|
| EPS, diluted | 4.01 | 4.99 | -1.12 | 5.17 | 8.93 |
| Real free cash flow per share | 3.18 | 8.17 | -4.04 | -0.15 | 0.83 |
| − Dividends paid, per share | 1.73 | 1.59 | 1.52 | 1.41 | 1.30 |
| − Share buybacks, per share | 6.62 | 4.36 | 5.04 | 2.54 | 0.16 |
What this means. The company's own free cash flow per share is much higher because it leaves out growth investments and uses its own adjustments, while our count includes more cash spending.
How much would NRG's dividend pay you?
$10,000 invested in NRG at its 2.0% dividend yield (our report of October 23, 2026) pays $200.00 in the first year, before tax. If its dividend per share keeps changing 7.4% a year, as it did from 2021 to 2025, and the dividends are reinvested, year 10 pays $483.75, with $3,199.91 received in all.
Before tax. Past dividend growth is not a promise. Information only, not investment advice.
Is NRG’s dividend covered by its cash?
Free cash flow means operating cash after purchases of property and equipment. It was weak or negative in several years before recovering, while shareholder payments across the period were much larger. That does not prove waste: a company can use existing cash, borrow, or sell assets. It does prove that distributions were not funded solely by contemporaneous operations.
Customer businesses create a timing problem. Vivint may require equipment and customer-acquisition spending today, then collect subscription revenue over several years. NRG’s projected $2.8 billion–$3.3 billion of free cash flow before growth investments therefore does not mean cash available after every obligation. The measure excludes selected growth spending and changes in trading collateral.
| 2025 | 2024 | 2023 | 2022 | 2021 | |
|---|---|---|---|---|---|
| Free cash flow | 766 | 1,834 | -819 | -7 | 224 |
| − Dividends paid | 344 | 338 | 347 | 332 | 319 |
| − Share buybacks | 1,318 | 925 | 1,150 | 600 | 39 |
| = Free cash flow not paid out | 571 | ||||
| = Paid out more than the free cash flow | 896 | 2,316 | 939 | 134 | |
| Paid out, % of real free cash flow | 263.0% | 72.9% | not meaningful | not meaningful | 176.4% |
What this means. The company paid shareholders more than its free cash flow in some years, using savings or new borrowing to make up the difference.
What could change NRG’s dividend?
| October 2027 | October 2028 | October 2029 | |
|---|---|---|---|
| Normal operating profit | 3,910 (3,077 / 4,200) | 4,301 (3,170 / 4,900) | 4,946 (3,424 / 5,800) |
| Dividends per share | 2.01 (1.76 / 2.03) | 2.05 (1.71 / 2.07) | 2.22 (1.71 / 2.26) |
| Net debt | 22,090 (22,804 / 21,944) | 20,867 (21,974 / 20,324) | 18,291 (20,084 / 17,434) |
What is NRG’s dividend yield against its price?
Revenue can grow through price changes or acquired businesses without stronger physical customer load. Operating margin and real free cash flow margin show whether earnings become cash after capital spending and stock-based pay; real free cash flow is computed from cash from operations minus capital spending and stock-based pay. Net debt captures expansion’s cost. The key warning is the gap between NRG’s own free-cash-flow-per-share measure and real free cash flow per share; real free cash flow yield is 3.2% against a 2.0% dividend yield.
The forecast’s weighted share price is $104.54 after one year and $225.96 after three years, excluding dividends. The first is a 13% gain from today’s $94.38. The third is a 146% gain. At the final date, the cases span $18.88 to $440.07.