NRG stock forecast 2027–2029
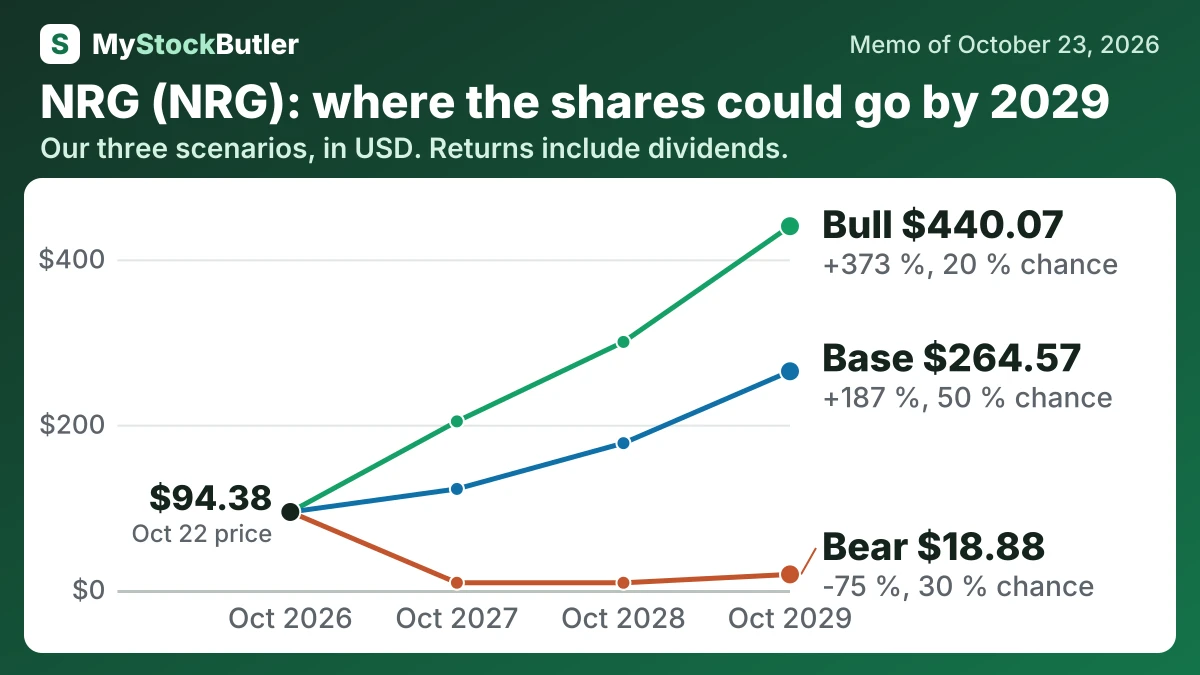
MyStockButler's October 2026 analysis: NRG's weighted forecast is $225.96 by October 2029, with Bear probability 30%, Base probability 50%, and Bull probability 20%. It hinges on cash conversion, debt reduction and project execution.
Where could NRG's shares be by October 2029?
The weighted forecast is $104.54 by October 2027, a +13% return. It is $225.96 by October 2029, a +146% return. Bear probability is 30%. Base probability is 50%. Bull probability is 20%. October 2029 outcomes span $18.88 to $440.07.
| Case | Probability | October 2027 | October 2028 | October 2029 |
|---|---|---|---|---|
| Bear | 30 % | 8.74 (-89 %) | 8.73 (-87 %) | 18.88 (-75 %) |
| Base | 50 % | 122.26 (+32 %) | 177.63 (+93 %) | 264.57 (+187 %) |
| Bull | 20 % | 203.97 (+118 %) | 300.07 (+222 %) | 440.07 (+373 %) |
| Weighted | 100 % | 104.54 (+13 %) | 151.45 (+65 %) | 225.96 (+146 %) |
What has to go right for NRG, and what could go wrong?
It leads to $8.74 after one year and $18.88 at the last date. The probability is 30%, because several risks can compound and NRG’s operating record is wide. The base remains the modal path at 50% because it requires progress, not flawless execution, and only a partial project contribution.
The bull case requires stronger Texas demand, reliable acquired plants, customer flexibility and project approvals. The plant contributes as it nears late-2029 operation. It leads to $203.97 after one year and $440.07 at the last date. Probability is 20%, because the outcome also needs strong cash conversion for large buybacks while construction and debt remain.
How much cash does NRG really make?
Revenue can grow through price changes or acquired businesses without stronger physical customer load. Operating margin and real free cash flow margin show whether earnings become cash after capital spending and stock-based pay; real free cash flow is computed from cash from operations minus capital spending and stock-based pay. Net debt captures expansion’s cost. The key warning is the gap between NRG’s own free-cash-flow-per-share measure and real free cash flow per share; real free cash flow yield is 3.2% against a 2.0% dividend yield.
| 2025 | 2024 | 2023 | 2022 | 2021 | |
|---|---|---|---|---|---|
| Cash from operations | 1,913 | 2,306 | -221 | 360 | 493 |
| − Capital spending | 1,147 | 472 | 598 | 367 | 269 |
| = Free cash flow | 766 | 1,834 | -819 | -7 | 224 |
| − Stock pay | 134 | 102 | 101 | 28 | 21 |
| = Real free cash flow | 632 | 1,732 | -920 | -35 | 203 |
| Real free cash flow, % of revenue | 2.1% | 6.2% | -3.2% | -0.1% | 0.8% |
What this means. The company's free cash flow is much higher because it leaves out some spending, including growth investments, that our count includes.
What does an investor pay for NRG today?
The price-to-earnings ratio compares the share price with annual profit, but trailing and forward versions describe different periods. NRG’s hedges limit exposure to changing electricity and fuel prices, yet accounting can revalue those contracts before the related customer revenue arrives. That can make reported earnings move before cash does.
| Today (Oct 22, 2026) | |
|---|---|
| Share price | 94.38 |
| Market value (calculated) | 19,839.67 |
| Enterprise value (calculated) | 42,933.67 |
| P/E, next 12 months (calculated) | 8.9x |
| Real free cash flow yield (calculated) | 3.2% |
| Dividend yield (calculated) | 2.0% |
What this means. Enterprise value is much higher than market value because it includes the company’s debt and subtracts its cash, showing what buying the whole business would cost.