NiSource dividend: cash flow and yield
MyStockButler's October 2026 analysis: NiSource's forecast dividend grows from $1.36 per share to $1.67 in the base case. In 2025, free cash flow was negative $1,892.5 million while NiSource paid $530.4 million in common dividends, so the dividend was not covered by free cash flow.
How much does NiSource pay in dividends?
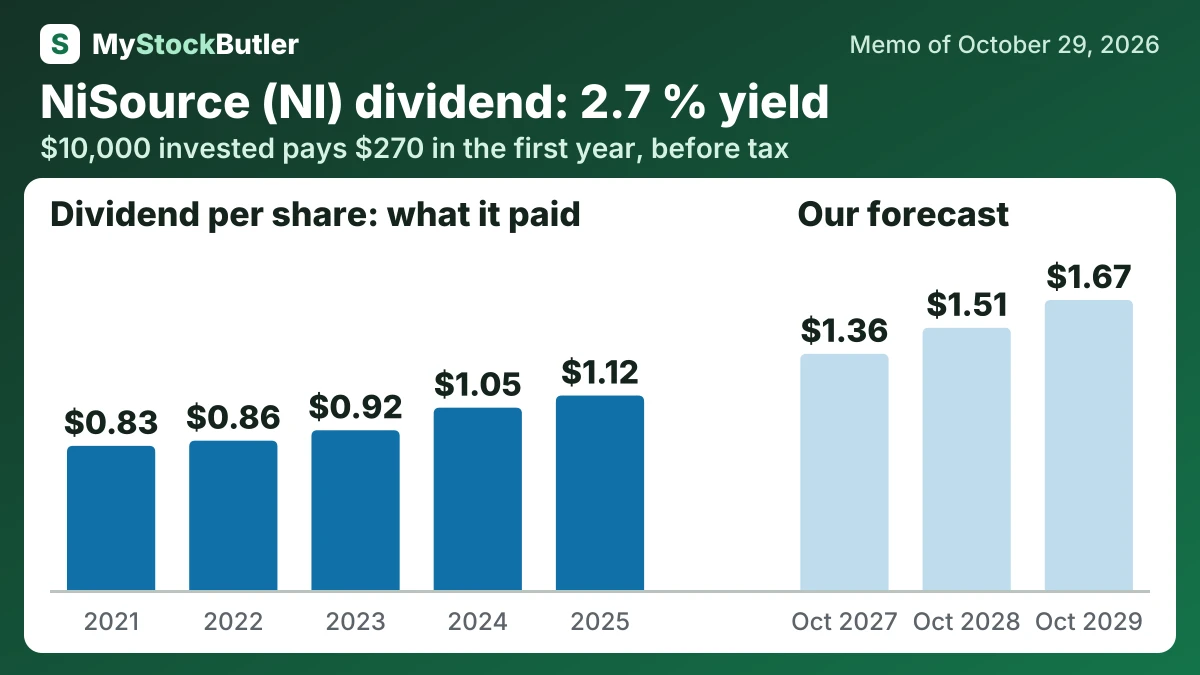
Dividends grow from $1.36 per share to $1.67 in the base case. The forecast applies a 60% payout to EPS growing from the $2.26 guidance midpoint. The bear case freezes the dividend at $1.20 because capital spending exceeded operating cash in 2025 and recovery could lag. The bull case reaches $1.88 by applying the 65% payout ceiling to stronger EPS growth.
| 2025 | 2024 | 2023 | 2022 | 2021 | |
|---|---|---|---|---|---|
| EPS, diluted | 1.95 | 1.62 | 1.48 | 1.70 | 1.27 |
| Real free cash flow per share | -4.10 | -3.04 | -3.36 | -2.58 | -2.12 |
| − Dividends paid, per share | 1.12 | 1.05 | 0.92 | 0.86 | 0.83 |
| − Share buybacks, per share | 0.00 | 0.00 | 0.00 | 0.00 | 0.00 |
How much would NiSource's dividend pay you?
$10,000 invested in NiSource at its 2.7% dividend yield (our report of October 29, 2026) pays $270.00 in the first year, before tax. If its dividend per share keeps changing 7.8% a year, as it did from 2021 to 2025, and the dividends are reinvested, year 10 pays $735.43, with $4,614.65 received in all.
Before tax. Past dividend growth is not a promise. Information only, not investment advice.
Is NiSource's dividend covered by its cash?
Free cash flow—the cash left after the investment spending captured in that measure—was negative in every year from 2021 through 2025. In 2025, it reached negative $1,892.5 million. NiSource still paid $530.4 million in common dividends and $88.8 million to minority owners. It made no share buybacks during those five years. The shortfall after those payments was $2,511.7 million.
| 2025 | 2024 | 2023 | 2022 | 2021 | |
|---|---|---|---|---|---|
| Free cash flow | -1,892.5 | -1,343.5 | -1,472.1 | -1,117.6 | -860.5 |
| − Dividends paid | 530.4 | 481.0 | 413.5 | 381.5 | 345.2 |
| − Share buybacks | 0 | 0 | 0 | 0 | 0 |
| = Paid out more than the free cash flow | 2,511.7 | 1,890.9 | 1,899.7 | 1,505.1 | 1,206.3 |
| Paid out, % of free cash flow | not meaningful | not meaningful | not meaningful | not meaningful | not meaningful |
What this means. The company paid dividends and other owner payments even though its free cash flow was negative, so it had to use savings or borrow money.
What could change NiSource's dividend?
The base case would gain support if utility investment enters recovery promptly, GenCo contributes under its announced plan and funding keeps FFO-to-debt near target. The bull case would become more credible if Microsoft and other large loads reach service milestones, more than 90% of investment enters recovery within twelve months, and customer payments or minority contributions reduce parent funding.
| October 2027 | October 2028 | October 2029 | |
|---|---|---|---|
| Earnings | 1,148 (1,068 / 1,172) | 1,291 (1,164 / 1,353) | 1,460 (1,253 / 1,558) |
| Shares (millions) | 498 (501 / 495) | 509 (517 / 503) | 520 (532 / 511) |
| Dividends per share | 1.36 (1.20 / 1.50) | 1.51 (1.20 / 1.67) | 1.67 (1.20 / 1.88) |
| Price to earnings | 20.00 (16.00 / 22.00) | 20.00 (15.50 / 23.00) | 20.50 (15.00 / 24.00) |
What is NiSource's dividend yield against its share price?
NiSource supplies gas and electricity through utility businesses and is building more infrastructure to serve growing demand. At $43.87 a share, the stock asks whether future earnings will grow fast enough to justify the price and the financing required to produce them.