CMS stock forecast 2027–2029
MyStockButler's October 2026 analysis: CMS's weighted forecast is $84.47 in October 2029. It hinges on MPSC approvals putting prudent projects into rates and keeping earned returns near authorized returns during 2027–2029.
Where could CMS's shares be by 2029?
The first weighted price is $76.71 in October 2027. It represents a 15% total return including dividends. The last is $84.47 in October 2029. It represents a 33% total return including dividends. Bear has 25% probability; base has 60%. Bull has 15%.
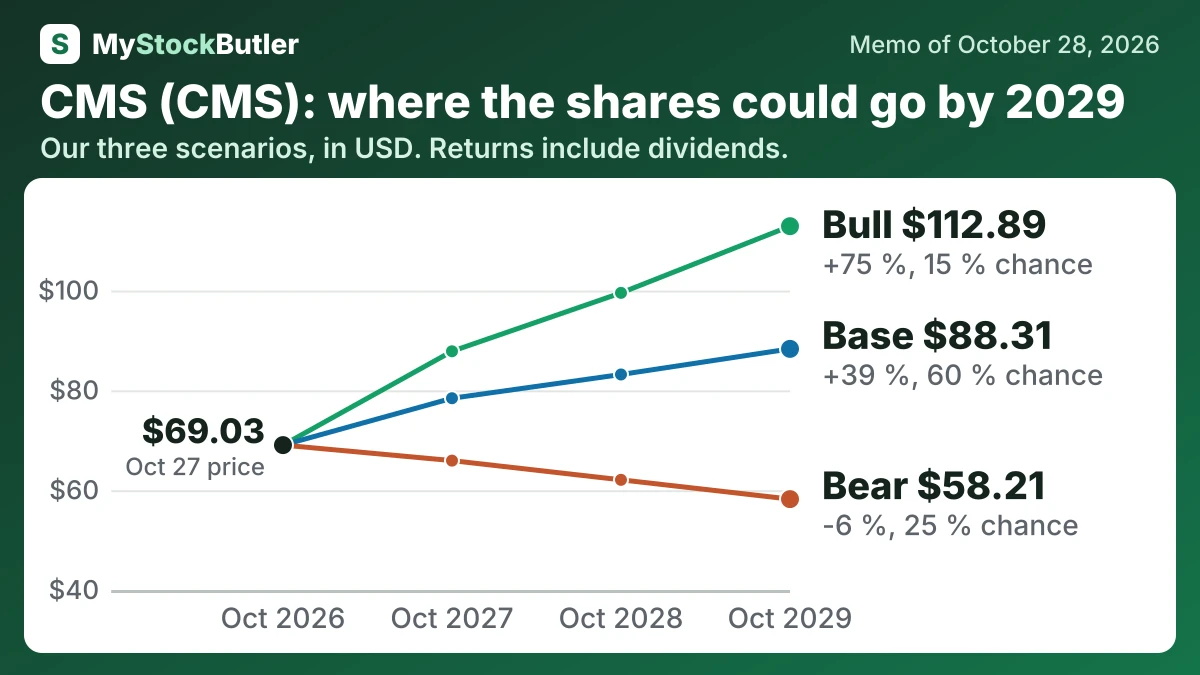
| Case | Probability | October 2027 | October 2028 | October 2029 |
|---|---|---|---|---|
| Bear | 25 % | 65.92 (-1 %) | 62.07 (-3 %) | 58.21 (-6 %) |
| Base | 60 % | 78.42 (+17 %) | 83.18 (+28 %) | 88.31 (+39 %) |
| Bull | 15 % | 87.83 (+31 %) | 99.53 (+51 %) | 112.89 (+75 %) |
| Weighted | 100 % | 76.71 (+15 %) | 80.36 (+23 %) | 84.47 (+33 %) |
What has to go right or wrong for CMS?
The outcome turns on MPSC approvals putting prudent projects into rates and keeping earned returns near authorized returns during 2027–2029. In October 2026, about 450 MW of new contracts had been energized. Those contracts totaled roughly 745 MW. The federal order—a government directive requiring J.H. Campbell to keep operating—is due to end November 14, 2026. NorthStar asset sales, financing costs and share issuance will show whether CMS reduces funding needs and preserves per-share growth. The investment case is growth that survives recovery risk, cash deficits and dilution.
How much cash does CMS really make?
“Real free cash flow” makes one further deduction for stock compensation. That is not a current construction bill, but it represents a cost to owners through possible dilution. Negative free cash flow is not automatically a failing signal for a growing utility; it means the gap must be financed until approved assets produce customer revenue.
| 2025 | 2024 | 2023 | 2022 | 2021 | |
|---|---|---|---|---|---|
| Cash from operations | 2,235 | 2,370 | 2,309 | 855 | 1,819 |
| − Capital spending | 3,824 | 3,018 | 3,219 | 2,374 | 2,076 |
| = Free cash flow | -1,589 | -648 | -910 | -1,519 | -257 |
| − Stock pay | 25 | 27 | 28 | 26 | 22 |
| = Real free cash flow | -1,614 | -675 | -938 | -1,545 | -279 |
| Real free cash flow, % of revenue | -18.9% | -9.0% | -12.6% | -18.0% | -3.8% |
What this means. The business brought in cash from daily operations, but it spent more on equipment and buildings, so free cash flow was negative.
What does an investor pay for CMS today?
CMS’s reported trailing valuation looks higher than its forward valuation because NorthStar restructuring charges reduced recent earnings. Adjusted guidance for 2026 is $3.83 to $3.90 a share. That measure helps show the continuing business, but the NorthStar losses were still real economic losses.
| Today (Oct 28, 2026) | |
|---|---|
| Share price | 69.03 |
| Market value (calculated) | 21,649.58 |
| Enterprise value (calculated) | 41,457.58 |
| P/E, last 12 months (calculated) | 24.7x |
| P/E, next 12 months (calculated) | 16.7x |
| Free cash flow yield (calculated) | -7.3% |
What this means. Enterprise value is the value of the whole business, so it adds debt and subtracts cash from the stock market value.