3M earnings date and guidance
MyStockButler's October 2026 analysis: 3M's next results are expected on January 19, 2027. Watch whether January's formal 2027 guidance becomes an operating plan.
What has 3M guided for 2026?
For 2026, management guides to stronger total sales, organic sales and adjusted earnings per share. Organic growth means growth from the existing business, excluding acquisitions, disposals and currency movements. It therefore asks whether customers bought more, rather than whether exchange rates translated the same sales into more dollars.
| Period guided | Low | High | Date it was given | |
|---|---|---|---|---|
| Adjusted total sales growth | Year to Dec 2026 | 4.5% | 2026-10-20 | |
| Adjusted organic sales growth | Year to Dec 2026 | 3.5% | 2026-10-20 | |
| 2026 adjusted earnings per share (non-GAAP measure) | Year to Dec 2026 | 9.10 | 9.15 | 2026-10-20 |
| 2026 adjusted operating income margin (non-GAAP measure) | Year to Dec 2026 | 24.6% | 24.6% | 2026-10-20 |
| 2026 adjusted effective tax rate (non-GAAP measure) | Year to Dec 2026 | 20.0% | 20.0% | 2026-10-20 |
| Adjusted free cash flow (non-GAAP measure) (US$ billions) | Year to Dec 2026 | 4.8 | 4.8 | 2026-10-20 |
Did 3M keep its past promises?
The record earns a middling assessment. Earnings usually met or beat initial ranges, but organic growth missed more often. Management reduced earnings expectations in 2021 and 2022. It also reduced sales expectations in 2022 and replaced its original 2024 outlook after separating Solventum. Currency and the Food Safety disposal affected total sales, but they do not explain an organic-growth miss.
| What management forecast | Checked | Above | Within | Below |
|---|---|---|---|---|
| Earnings per share / Adjusted EPS | 4 years | 3 | 1 | 0 |
| Total sales growth / Adjusted total sales growth | 4 years | 2 | 1 | 1 |
| Organic local-currency sales growth / Adjusted organic sales growth | 4 years | 1 | 1 | 2 |
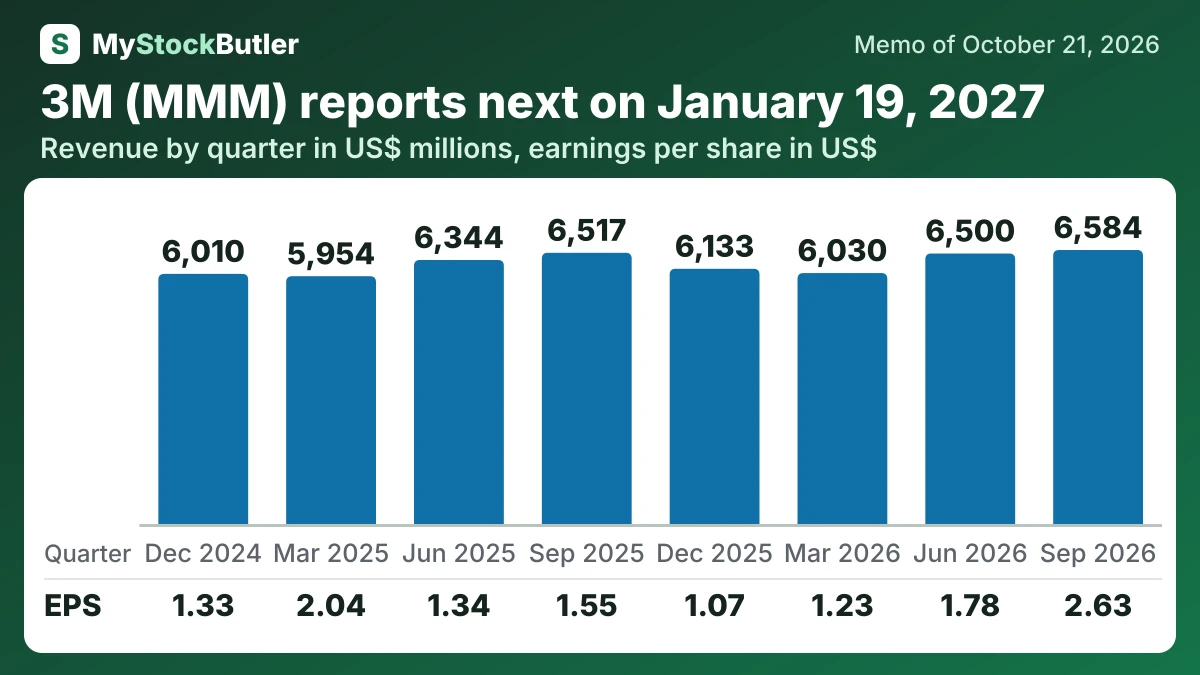
What has 3M's last eight quarters shown?
Revenue and operating income improved from the prior-year quarter, while gross margin also strengthened. Net income and diluted EPS rose much faster than sales, so the quarter’s headline growth cannot describe the factory operation alone.
| Sep 2026 | Jun 2026 | Mar 2026 | Dec 2025 | Sep 2025 | Jun 2025 | Mar 2025 | Dec 2024 | |
|---|---|---|---|---|---|---|---|---|
| Revenue | 6,584 | 6,500 | 6,030 | 6,133 | 6,517 | 6,344 | 5,954 | 6,010 |
| Gross margin | 42.3% | 41.3% | 40.7% | 33.6% | 41.8% | 42.5% | 41.6% | 37.7% |
| Operating income | 1,558 | 984 | 1,397 | 796 | 1,447 | 1,140 | 1,246 | 1,085 |
| Net income | 1,373 | 933 | 653 | 577 | 834 | 723 | 1,116 | 728 |
| EPS, diluted | 2.63 | 1.78 | 1.23 | 1.07 | 1.55 | 1.34 | 2.04 | 1.33 |
| = Free cash flow | 230 | 763 | 349 | 1,335 | 1,538 | -1,162 | -315 | 1,527 |
What should 3M watch in January 2027?
January’s formal 2027 guidance will reveal whether management’s confidence has become an operating plan.
The fourth-quarter GSEO investment offers an earlier checkpoint. Closing the deal establishes a manufacturing relationship, but only customer qualification, deployment and repeat purchases will show adoption.