Leidos dividend
MyStockButler's October 2026 analysis: Leidos paid $1.80 to $2.00 per share in the base forecast, and Leidos generated $1.625 billion of free cash flow in fiscal 2025. Leidos’s real free cash flow was $1.53 billion after stock compensation, leaving cash for dividends, buybacks and debt reduction.
How much does Leidos pay per share?
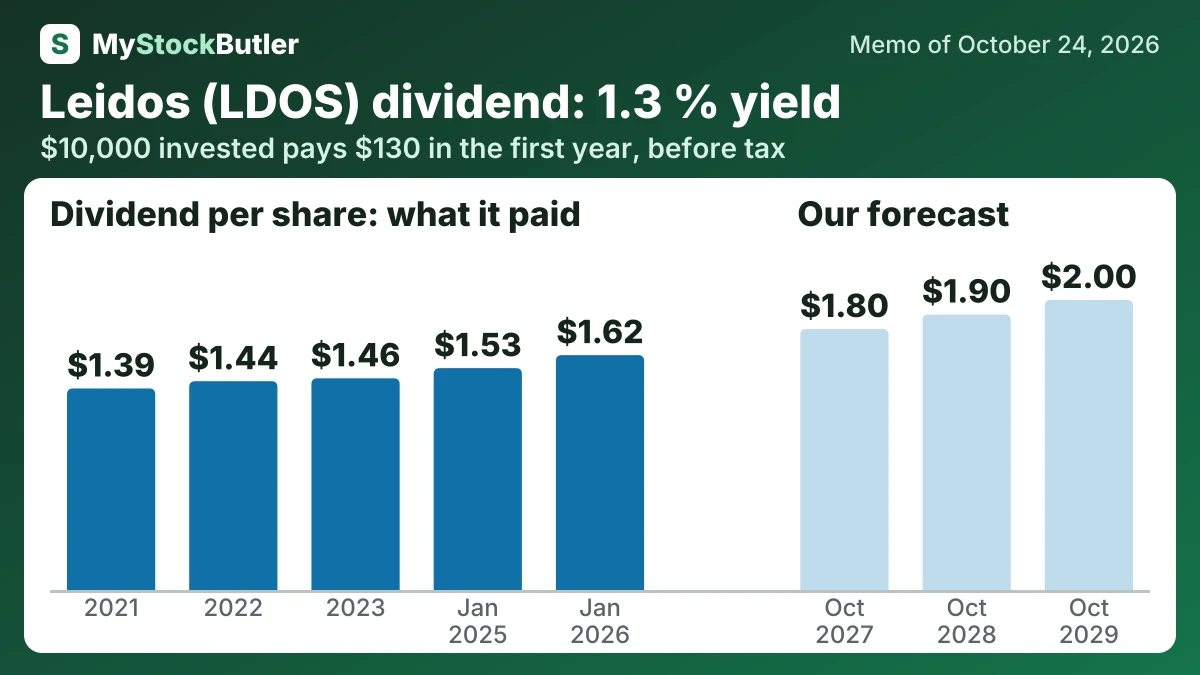
Dividends rise modestly in the base case, from $1.80 to $2.00 per share. The bear case holds the payout at $1.72 before a small increase to $1.76, while the bull case reaches $2.26 from $1.88. The base path follows the uninterrupted dividend history and strong operating cash flow, which reached $1,750 million in fiscal 2025.
| Jan 2026 | Jan 2025 | 2023 | 2022 | 2021 | |
|---|---|---|---|---|---|
| Revenue | 17,174 | 16,662 | 15,438 | 14,396 | 13,737 |
| EPS, diluted | 11.14 | 9.22 | 1.44 | 4.96 | 5.27 |
| Dividend per share | 1.63 | 1.54 | 1.46 | 1.44 | 1.40 |
What this means. Gross profit is our calculation from sales minus direct costs because Leidos does not report one total gross-profit figure.
How much would Leidos's dividend pay you?
$10,000 invested in Leidos at its 1.3% dividend yield (our report of October 24, 2026) pays $130.00 in the first year, before tax. If its dividend per share keeps changing 3.9% a year, as it did from 2021 to Jan 2026, and the dividends are reinvested, year 10 pays $210.20, with $1,666.83 received in all.
Before tax. Past dividend growth is not a promise. Information only, not investment advice.
Is Leidos’s dividend covered by its cash?
Leidos converts profit into substantial cash with modest capital spending, but working capital and tax timing affect the result. Operating cash flow rose from $1.03 billion in 2021 to $1.75 billion in fiscal 2025. Capital spending was $125 million, leaving $1.625 billion of free cash flow.
Stock compensation was $95 million in fiscal 2025. Treating it as an economic cost leaves real free cash flow of $1.53 billion, because employees received value without an immediate cash payment. That measure should be read beside buybacks: some repurchases may offset shares issued to employees rather than reduce the owners’ share of the business. Cash strength now leads to the question of how much debt the balance sheet can carry.
| Jan 2026 | Jan 2025 | 2023 | 2022 | 2021 | |
|---|---|---|---|---|---|
| Free cash flow | 1,625 | 1,286 | 980 | 863 | 929 |
| − Dividends paid | 211 | 208 | 201 | 199 | 199 |
| − Share buybacks | 900 | 850 | 225 | 500 | 237 |
| = Free cash flow not paid out | 498 | 222 | 545 | 157 | 493 |
| Paid out, % of free cash flow | 68.4% | 82.3% | 43.5% | 81.0% | 46.9% |
What this means. The last percentage is higher because it subtracts stock-based pay from free cash flow, treating that employee compensation as a real cost.
What could change Leidos’s dividend?
The first decisive evidence will come from Health. A lower-priced VA renewal or continued incentive-payment pressure in 2027–2028 would move earnings toward the bear case; a margin near 20% would support the base case.
| October 2027 | October 2028 | October 2029 | |
|---|---|---|---|
| Earnings | 1,523 (1,419 / 1,625) | 1,639 (1,428 / 1,823) | 1,763 (1,437 / 1,999) |
| Shares (millions) | 123 (125 / 121) | 121 (124 / 117) | 118 (124 / 113) |
| Dividends per share | 1.80 (1.72 / 1.88) | 1.90 (1.72 / 2.06) | 2.00 (1.76 / 2.26) |
| Price to earnings | 11.00 (10.50 / 13.00) | 11.50 (9.50 / 14.00) | 12.00 (9.00 / 15.00) |