Jacobs stock forecast 2027–2029
MyStockButler's October 2026 analysis: Jacobs’s weighted forecast reaches $182.45 in October 2029, a 29% return including dividends. It hinges on backlog converting into cash and lower leverage.
Where could Jacobs’s shares be by 2029?
The weighted price is $146.81 in October 2027, a 2% total return including dividends. It becomes $162.47 in October 2028, a 14% return. It reaches $182.45 in October 2029, a 29% return.
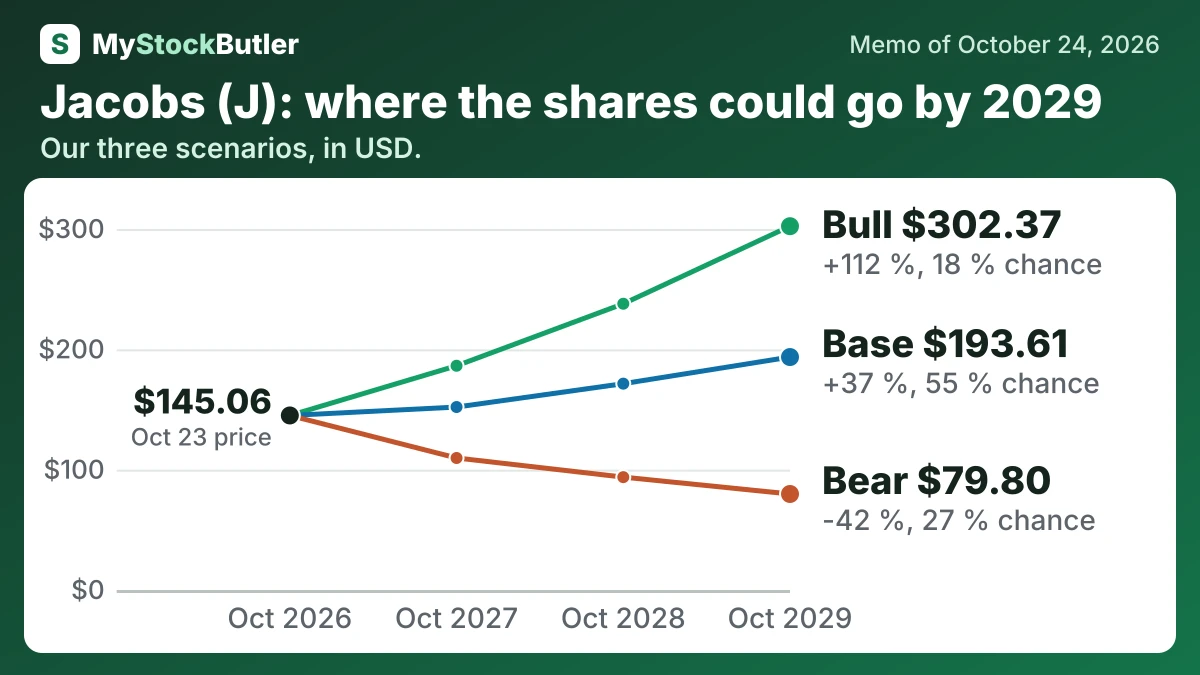
Jacobs share price scenarios for October 2029: bear $79.80, base $193.61, bull $302.37
| October 2027 | October 2028 | October 2029 | |
|---|---|---|---|
| Earnings | 977 (803 / 1,065) | 1,059 (785 / 1,206) | 1,149 (780 / 1,371) |
| Shares (millions) | 116 (117 / 114) | 114 (117 / 112) | 113 (117 / 109) |
| Dividends per share | 1.56 (1.44 / 1.60) | 1.72 (1.44 / 1.80) | 1.88 (1.44 / 2.00) |
| Price to earnings | 18.00 (16.00 / 20.00) | 18.50 (14.00 / 22.00) | 19.00 (12.00 / 24.00) |
What has to go right or wrong for Jacobs?
The base begins near the $979 million implied by next-twelve-month consensus EPS and diluted shares. It also reflects a $28.9 billion backlog, up 27% year over year, and a 1.4-times gross-revenue book-to-bill ratio. Jacobs’ guidance for adjusted net revenue growth of 9.5%–10.0% and an adjusted EBITDA margin of 14.7%–14.8% supports measured progress, not a sudden acceleration. The bear reflects delayed awards and fixed-price pressure; the bull requires stronger utilization and global delivery.
How much cash does Jacobs really make?
Free cash flow is operating cash after capital spending. In fiscal 2025, operations produced $686.7 million. Capital spending was $79.2 million, leaving $607.5 million of free cash flow.
The PA buyout made the distinction sharper. Transaction-related employee payments totalled $342.4 million through June, depressing 2026 cash even when operations later recovered. Adding those payments back can describe operating cash apart from the transaction, but employees received real money and the cost belongs in the economic story.
| Sep 2025 | Sep 2024 | Sep 2023 | Sep 2022 | |
|---|---|---|---|---|
| Cash from operations | 686,704 | 825,728 | 689,544 | 226,249 |
| − Capital spending | 79,232 | 108,047 | 111,038 | 96,771 |
| = Free cash flow | 607,472 | 717,681 | 578,506 | 129,478 |
| − Stock pay | 60,960 | |||
| = Real free cash flow | 546,512 |
What this means. The company's free cash flow matches ours, but real free cash flow is lower because shares given to employees reduce existing owners' share of the company.
What does an investor pay for Jacobs today?
The earnings multiples tell the central story. P/E means share price divided by earnings per share. The trailing version uses earnings already reported; the forward version uses an estimate of future earnings. Jacobs’ FY2025 diluted EPS from continuing operations was $2.58, total diluted EPS was $2.38, and adjusted EPS was $6.12. Adjusted EPS removes selected charges, so the implied recovery depends partly on which earnings definition the forecast uses.
| Today (Oct 24, 2026) | |
|---|---|
| Share price | 145.06 |
| Market value (calculated) | 16,977,620.91 |
| P/E, last 12 months (calculated) | 48.4x |
| P/E, next 12 months (calculated) | 17.6x |
| Real free cash flow yield (calculated) | 3.2% |
What this means. Enterprise value is higher than market value because it adds the company's debt and subtracts its cash, showing what it would cost to buy the whole business.