Kinder Morgan earnings date and guidance
MyStockButler's October 2026 analysis: Kinder Morgan’s next results are expected on January 20, 2027. Watch signed contracts, permits and financing actions, not simply project announcements.
What has Kinder Morgan guided for 2026?
The budget for the year ending December 2026 is KMI’s original promise. It calls for net income attributable to KMI of $3.1 billion. It also calls for adjusted earnings per share, or EPS, of $1.36. Adjusted EBITDA, which measures operating earnings before interest, taxes and depreciation, was budgeted at $8.6 billion.
On October 21, KMI said adjusted EBITDA should finish more than 6.0% above budget. It also said adjusted EPS should finish more than 13.0% above budget, with year-end net debt-to-EBITDA leverage of 3.6 times.
| The period guided | Low | High | The date it was given | |
|---|---|---|---|---|
| Net income attributable to KMI (budget, US$ billions) | Year to Dec 2026 | 3.1 | 3.1 | Oct 21, 2026 |
| Adjusted EPS (budget) | Year to Dec 2026 | 1.36 | 1.36 | Oct 21, 2026 |
| Declared dividends per share | Year to Dec 2026 | 1.19 | 1.19 | Oct 21, 2026 |
| Adjusted EBITDA (budget, US$ billions) | Year to Dec 2026 | 8.6 | 8.6 | Oct 21, 2026 |
| Adjusted EBITDA — favorable to budget | Year to Dec 2026 | 6.0% | Oct 21, 2026 | |
| Net Debt-to-Adjusted EBITDA | Year to Dec 2026 | 3.6x | 3.6x | Oct 21, 2026 |
What promises has Kinder Morgan kept?
Management’s forecasting record is mixed. Only seven of fourteen comparable metric-years exceeded the first forecast. Adjusted EBITDA beat its initial forecast in three of five years, with relatively small misses when it fell short. The record also includes commodity weakness, delayed renewable natural gas facilities and higher operating costs, so not every disappointment was an accounting issue.
| What management forecast | Checked | Above | Within | Below |
|---|---|---|---|---|
| Net income attributable to Kinder Morgan, Inc. (GAAP) | 5 years | 2 | 0 | 3 |
| Adjusted EBITDA | 5 years | 3 | 0 | 2 |
| DCF | 4 years | 2 | 0 | 2 |
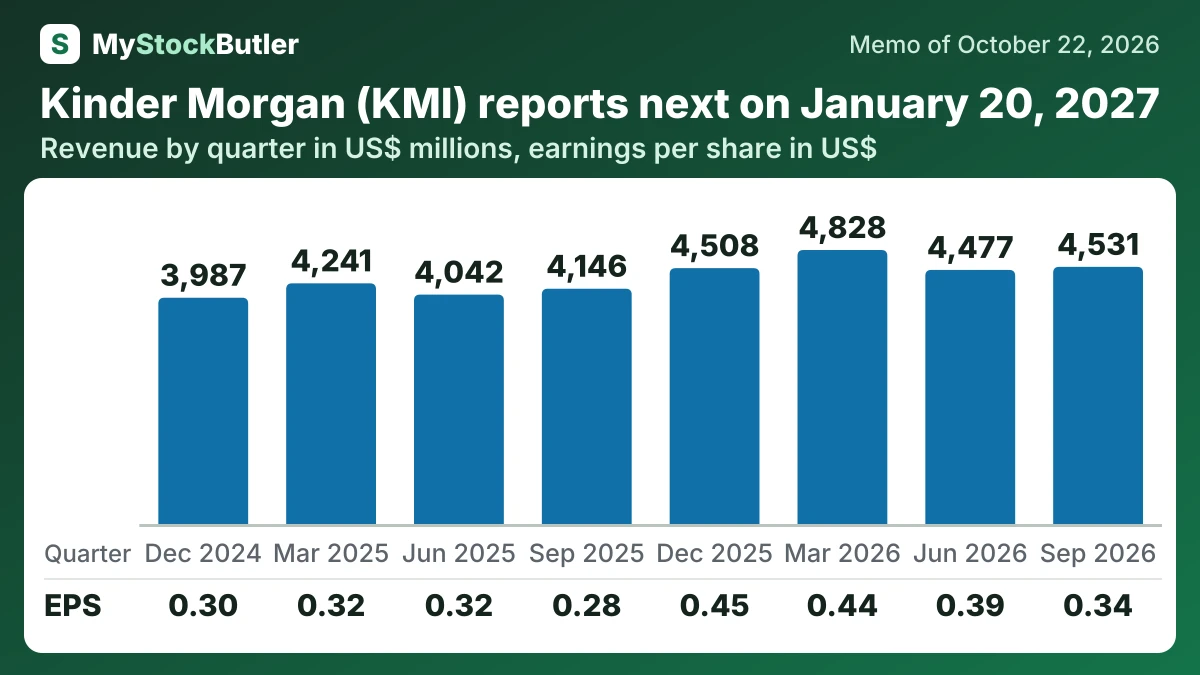
What have Kinder Morgan results shown over the last eight quarters?
Revenue rose 9.3% to $4,531 million year over year. Net income rose 21.7% to $764 million. Natural-gas transport volume increased about 3%, while gathering increased about 14%. That supports the gas-led growth story, although one quarter cannot establish its permanence.
| Sep 2026 | Jun 2026 | Mar 2026 | Dec 2025 | Sep 2025 | Jun 2025 | Mar 2025 | Dec 2024 | |
|---|---|---|---|---|---|---|---|---|
| Revenue | 4,531 | 4,477 | 4,828 | 4,508 | 4,146 | 4,042 | 4,241 | 3,987 |
| Gross margin | 65.4% | 68.6% | 63.8% | 67.9% | 66.4% | 70.0% | 65.2% | 68.9% |
| Operating income | 1,160 | 1,346 | 1,444 | 1,364 | 1,063 | 1,152 | 1,145 | 1,108 |
| Net income | 764 | 867 | 976 | 996 | 628 | 715 | 717 | 667 |
| EPS, diluted | 0.34 | 0.39 | 0.44 | 0.45 | 0.28 | 0.32 | 0.32 | 0.30 |
| = Free cash flow | 545 | 978 | 687 | 872 | 621 | 1,002 | 396 | 738 |
What this means. Gross margin is not the company's final profit because it does not subtract expenses such as operations, maintenance, and depreciation.
What should you watch before Kinder Morgan results?
The next evidence will be signed contracts, permits and financing actions, not simply management’s project announcements.