Kinder Morgan dividend
MyStockButler's October 2026 analysis: Kinder Morgan's declared 2026 dividend is $1.19 per share. Kinder Morgan can currently support its dividend, but in 2025 dividends absorbed 90.1% of free cash flow.
How much does Kinder Morgan pay in dividends?
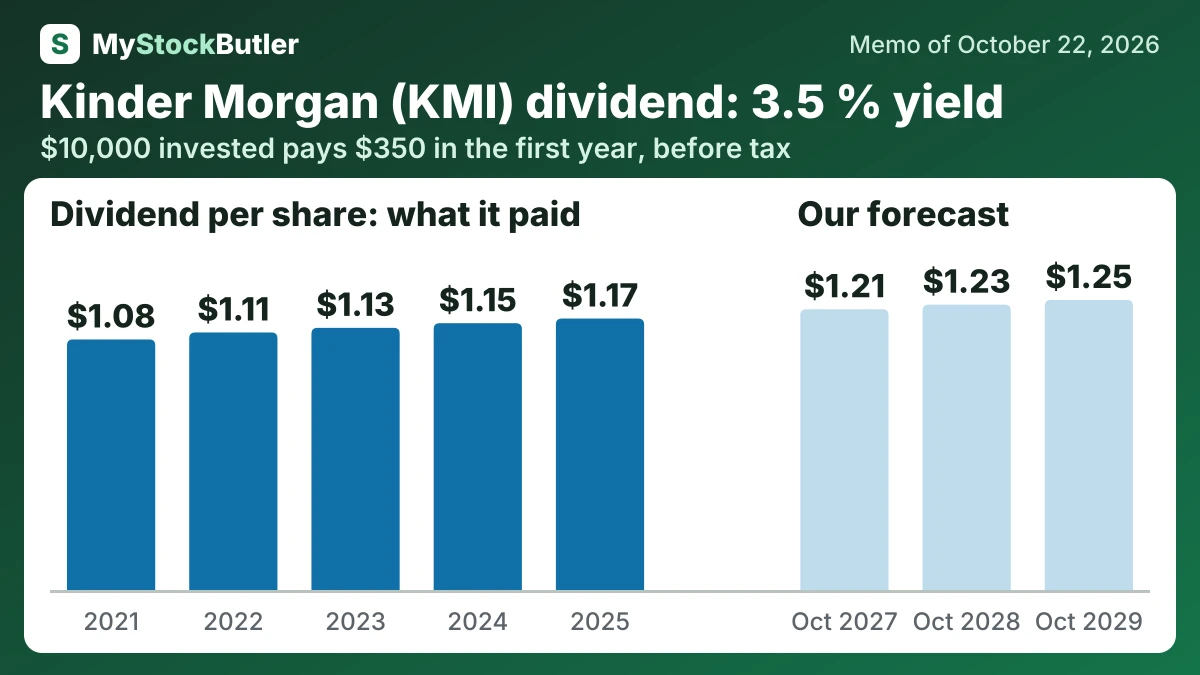
Management expects 2026 adjusted EBITDA to finish more than 6.0% above its budget and adjusted EPS more than 13.0% above budget. Year-end net debt-to-adjusted EBITDA guidance is 3.6x. The declared 2026 dividend is $1.19 per share, alongside substantial expansion investment.
Dividends per share rise from $1.21 to $1.25 in the base case, reflecting roughly 2% annual growth from the declared $1.19 rate. The bear case holds at $1.19 because dividends already absorbed 90.1% of 2025 free cash flow. The bull case reaches $1.32, requiring stronger cash generation without repeating the 2015 cut.
| 2025 | 2024 | 2023 | 2022 | 2021 | |
|---|---|---|---|---|---|
| Real free cash flow per share | 1.27 | 1.33 | 1.84 | 1.46 | 1.93 |
| − Dividends paid, per share | 1.17 | 1.15 | 1.13 | 1.11 | 1.08 |
| − Share buybacks, per share | 0.00 | 0.00 | 0.23 | 0.16 | 0.00 |
| = FCF not paid out, per share | 0.06 | 0.13 | 0.44 | 0.16 | 0.83 |
What this means. The company's free cash flow per share is higher than our real free cash flow per share because its count does not subtract shares given to employees as pay.
How much would Kinder Morgan's dividend pay you?
$10,000 invested in Kinder Morgan at its 3.5% dividend yield (our report of October 22, 2026) pays $350.00 in the first year, before tax. If its dividend per share keeps changing 2.0% a year, as it did from 2021 to 2025, and the dividends are reinvested, year 10 pays $586.04, with $4,570.51 received in all.
Before tax. Past dividend growth is not a promise. Information only, not investment advice.
Is Kinder Morgan's dividend covered by its cash?
By 2025, dividends of $2,604 million absorbed 90.1% of free cash flow, leaving just $134 million after minority payments. Buybacks also declined sharply after 2023. Debt activity was mostly refinancing: in 2025, KMI issued $10,017 million and repaid $10,054 million. Refinancing can keep the business funded, but it does not substantially shrink the debt burden.
Operating cash flow was $5,917 million in 2025. Capital spending was $3,026 million, leaving $2,891 million of free cash flow. After deducting $68 million of stock compensation, the remaining “real free cash flow” was $2,823 million. The deduction recognizes employees’ claim on shareholder value.
| 2025 | 2024 | 2023 | 2022 | 2021 | |
|---|---|---|---|---|---|
| Free cash flow | 2,891 | 3,006 | 4,174 | 3,346 | 4,427 |
| − Paid to minority owners | 153 | 154 | 151 | 116 | 102 |
| − Dividends paid | 2,604 | 2,557 | 2,529 | 2,504 | 2,443 |
| − Share buybacks | 0 | 7 | 522 | 368 | 0 |
| = Free cash flow not paid out | 134 | 288 | 972 | 358 | 1,882 |
| Paid out, % of free cash flow | 90.1% | 85.3% | 73.1% | 85.8% | 55.2% |
What this means. Our net debt is higher than the company's own figure because we include changes in debt values and exchange rates that the company leaves out.
What could change Kinder Morgan's dividend?
During 2027, earnings must hold after weather, spread and commodity benefits fade, while cash generation keeps pace with dividends and construction. The revolving credit facility expires in August 2027 unless renewed or replaced. Permits, construction progress and project-level returns will determine whether Southeast Connector and Permian Link reach their targeted 2030 service dates on acceptable economics.
| October 2027 | October 2028 | October 2029 | |
|---|---|---|---|
| EBITDA | 9,283 (8,603 / 9,633) | 9,533 (8,625 / 10,117) | 9,822 (8,775 / 10,700) |
| Dividends per share | 1.21 (1.19 / 1.23) | 1.23 (1.19 / 1.27) | 1.25 (1.19 / 1.32) |
| Enterprise value to ebitda | 13.50 (11.50 / 15.00) | 13.25 (11.00 / 15.50) | 13.00 (10.50 / 16.00) |
| Net debt | 32,652 (33,672 / 32,362) | 31,982 (34,322 / 31,242) | 30,682 (34,342 / 29,132) |