Kinder Morgan stock forecast 2027–2029
MyStockButler's October 2026 analysis: The probability-weighted scenario reaches $42.16 by October 2029. It hinges on contracted gas growth becoming durable cash growth before debt, dividends and project spending constrain it.
Where could Kinder Morgan’s shares be by October 2029?
The forecast puts the greatest weight on moderate growth after an unusually strong 2026. The probability-weighted price reaches $39.83 in October 2027, $40.64 in October 2028 and $42.16 in October 2029. Including dividends, those outcomes represent returns of 21%, 27% and 35% from today’s $33.97.
The range is wide because EBITDA, leverage and valuation could move together. By October 2029, the bear case reaches $25.88, while the bull case reaches $64.14. The forecast assigns probabilities of 25% to the bear, 60% to the base and 15% to the bull.
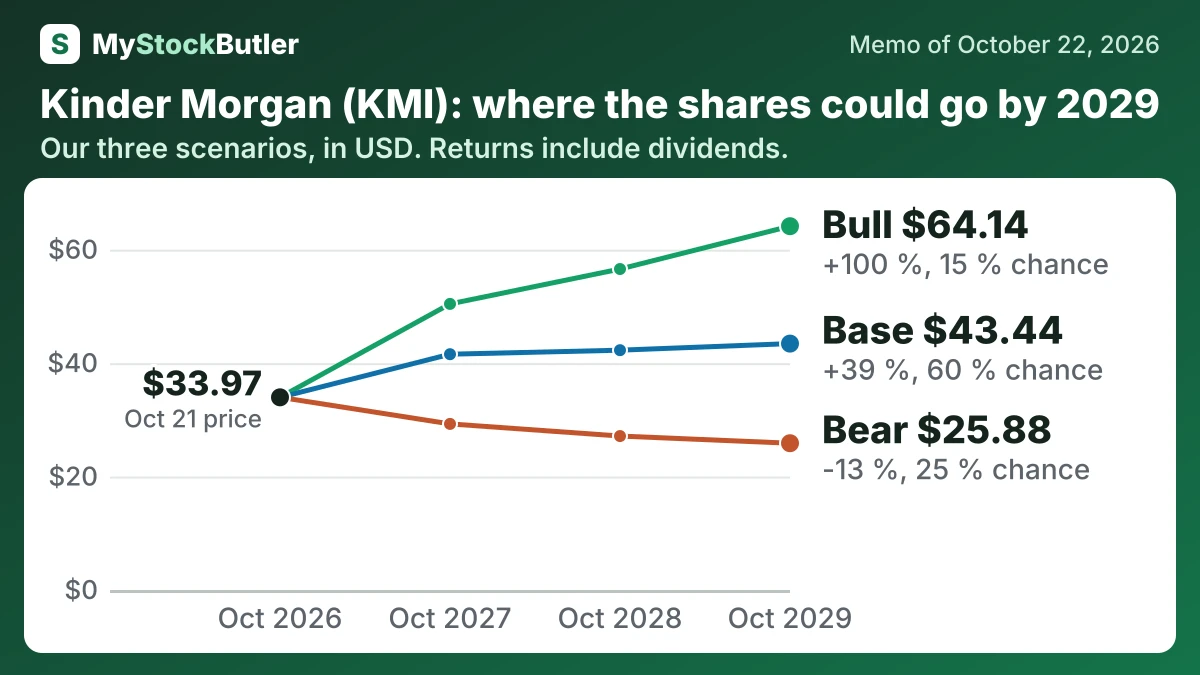
| Case | Probability | October 2027 | October 2028 | October 2029 |
|---|---|---|---|---|
| Bear | 25 % | 29.28 (-10 %) | 27.14 (-13 %) | 25.88 (-13 %) |
| Base | 60 % | 41.57 (+26 %) | 42.28 (+32 %) | 43.44 (+39 %) |
| Bull | 15 % | 50.44 (+52 %) | 56.59 (+74 %) | 64.14 (+100 %) |
| Weighted | 100 % | 39.83 (+21 %) | 40.64 (+27 %) | 42.16 (+35 %) |
What has to go right or wrong for Kinder Morgan?
EBITDA is the main operating driver. The base case rises from $9,283 million in October 2027 to $9,533 million in October 2028, then $9,822 million in October 2029. That path normalizes exceptional weather and commodity gains but preserves contracted gas growth. Management expects 2026 EBITDA to finish more than 6% above its $8.6 billion budget, while gas transport volumes rose from 38,577 BBtu per day in 2021 to 46,603 in 2025.
The bear case requires 2026’s temporary gains to unwind before contracted growth replaces them. Delayed permits, construction overruns or expensive refinancing then absorb cash, push debt higher and compress the multiple. The shares fall to $29.28 by October 2027 and $25.88 by October 2029. Its 25% probability reflects the high payout, construction burden and history of capital-market stress, while contracted pipelines limit the chance of a deeper collapse.
| October 2027 | October 2028 | October 2029 | |
|---|---|---|---|
| EBITDA | 9,283 (8,603 / 9,633) | 9,533 (8,625 / 10,117) | 9,822 (8,775 / 10,700) |
| Shares (millions) | 2,229 (2,229 / 2,223) | 2,231 (2,231 / 2,219) | 2,233 (2,233 / 2,215) |
| Dividends per share | 1.21 (1.19 / 1.23) | 1.23 (1.19 / 1.27) | 1.25 (1.19 / 1.32) |
| Enterprise value to ebitda | 13.50 (11.50 / 15.00) | 13.25 (11.00 / 15.50) | 13.00 (10.50 / 16.00) |
| Net debt | 32,652 (33,672 / 32,362) | 31,982 (34,322 / 31,242) | 30,682 (34,342 / 29,132) |
How much cash does Kinder Morgan really make?
Operating cash flow was $5,917 million in 2025. Capital spending was $3,026 million, leaving $2,891 million of free cash flow. After deducting $68 million of stock compensation, the remaining “real free cash flow” was $2,823 million. The deduction recognizes employees’ claim on shareholder value.
| 2025 | 2024 | 2023 | 2022 | 2021 | |
|---|---|---|---|---|---|
| Cash from operations | 5,917 | 5,635 | 6,491 | 4,967 | 5,708 |
| − Capital spending | 3,026 | 2,629 | 2,317 | 1,621 | 1,281 |
| = Free cash flow | 2,891 | 3,006 | 4,174 | 3,346 | 4,427 |
| − Stock pay | 68 | 64 | 60 | 60 | 59 |
| = Real free cash flow | 2,823 | 2,942 | 4,114 | 3,286 | 4,368 |
What this means. Real free cash flow subtracts stock pay because shares given to employees reduce what shareholders own, even though no cash leaves the company.