Jack Henry dividend
MyStockButler's October 2026 analysis: Jack Henry paid $170.4 million in dividends in FY26. Its FY26 free cash flow was about $539.3 million, though that included asset-sale proceeds and a significant tax benefit.
How much does Jack Henry pay its shareholders over time?
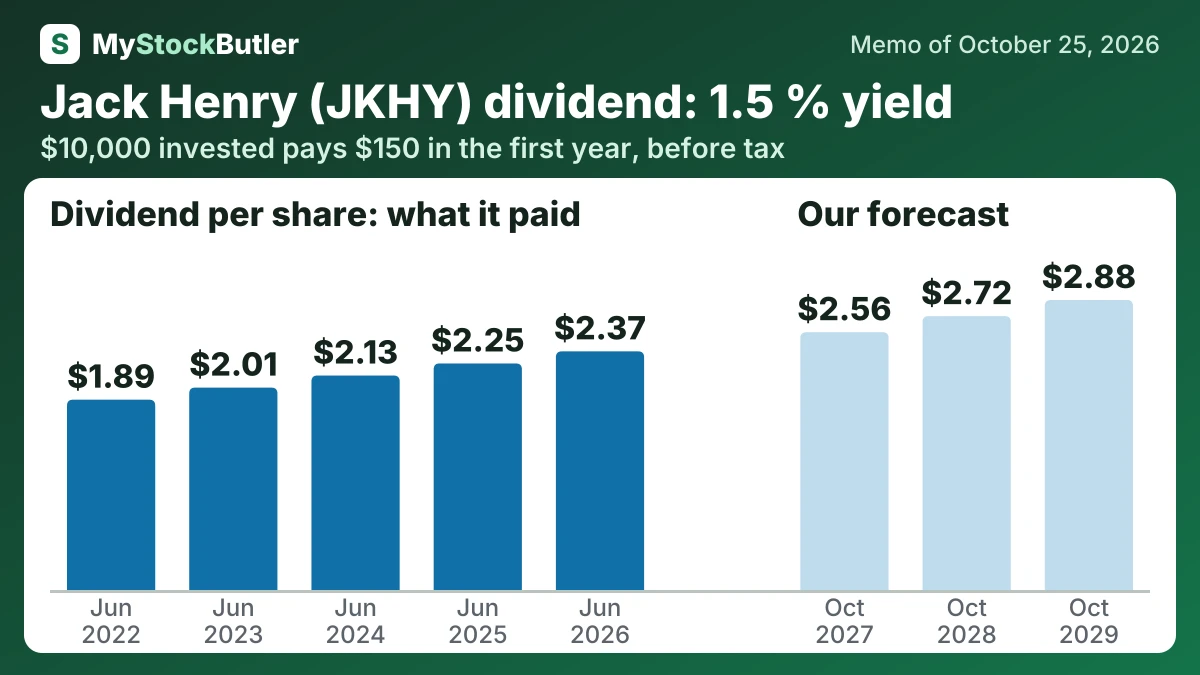
Dividends rise in the base case from $2.56 per share to $2.72. They reach $2.88 by the last date. The bear holds the current annualized rate at $2.44, while the bull reaches $2.60, $2.80 and $3.00. The base follows a record of 5–6% annual increases and 22 consecutive years of growth.
| Jun 2026 | Jun 2025 | Jun 2024 | Jun 2023 | Jun 2022 | |
|---|---|---|---|---|---|
| Free cash flow per share | 9.65 | 8.05 | 6.98 | 4.68 | 6.40 |
| − Dividends paid, per share | 2.37 | 2.25 | 2.13 | 2.01 | 1.89 |
| − Share buybacks, per share | 6.22 | 0.48 | 0.38 | 0.34 | 2.64 |
| = FCF not paid out, per share | 1.06 | 5.32 | 4.46 | 2.33 | 1.86 |
What this means. The company's own free cash flow per share is lower because it also subtracts spending on software, while our count subtracts only equipment spending.
How much would Jack Henry's dividend pay you?
$10,000 invested in Jack Henry at its 1.5% dividend yield (our report of October 25, 2026) pays $150.00 in the first year, before tax. If its dividend per share keeps changing 5.8% a year, as it did from Jun 2022 to Jun 2026, and the dividends are reinvested, year 10 pays $295.69, with $2,142.32 received in all.
Before tax. Past dividend growth is not a promise. Information only, not investment advice.
Is Jack Henry’s dividend covered by its cash?
Free cash flow is not the same as the dividend. Jack Henry’s FY26 free cash flow was about $539.3 million, including $32.8 million from asset sales, and it benefited from a significant non-recurring tax benefit. The resulting company-defined yield is roughly 4.7%, below the snapshot’s stated yield. The company paid $170.4 million in dividends, so investors must judge the dividend against recurring cash after investment and normal taxes.
| Jun 2026 | Jun 2025 | Jun 2024 | Jun 2023 | Jun 2022 | |
|---|---|---|---|---|---|
| Free cash flow | 694,857 | 588,146 | 509,923 | 342,380 | 469,972 |
| − Dividends paid | 170,405 | 164,644 | 155,877 | 147,237 | 139,070 |
| − Share buybacks | 448,173 | 35,051 | 28,055 | 25,000 | 193,916 |
| = Free cash flow not paid out | 76,279 | 388,451 | 325,991 | 170,143 | 136,986 |
| Paid out, % of free cash flow | 89.0% | 34.0% | 36.1% | 50.3% | 70.9% |
What could change Jack Henry’s dividend?
Finally, cash allocation will reveal execution quality. Cash sufficient to fund dividends, the $250 million repurchase framework and investment would support the base case. Weaker cash conversion or reduced repurchases would move the share-count and net-debt paths toward the bear case.
| October 2027 | October 2028 | October 2029 | |
|---|---|---|---|
| Free cash flow after stock pay | 663 (553 / 743) | 717 (533 / 837) | 743 (568 / 880) |
| Shares (millions) | 68.82 (69.67 / 68.35) | 67.61 (69.11 / 66.48) | 66.48 (68.46 / 64.51) |
| Dividends per share | 2.56 (2.44 / 2.60) | 2.72 (2.44 / 2.80) | 2.88 (2.44 / 3.00) |
| Net debt | -250 (-282 / -230) | -572 (-555 / -517) | -911 (-838 / -784) |