Ingersoll Rand earnings date and guidance
MyStockButler's October 2026 analysis: Ingersoll Rand's next results are expected on October 29, 2026. For Ingersoll Rand, watch orders, pricing, margins and cash from ordinary operations.
What has Ingersoll Rand guided for the year?
Organic growth means sales from businesses IR already owned, after removing acquisitions and currency movements. Management’s July 30 outlook calls for revenue growth of 4.5%–6.5% in 2026. It expects 1.0%–3.0% organic growth. Acquisitions add about 2.5%, while currency adds 1.0%.
The weighted case puts IR below today’s price, hinging on earnings recovery, acquisition returns and margin improvement. For 2026, management guides to 4.5%–6.5% revenue growth, including 1.0%–3.0% organic growth. It expects adjusted EPS of $3.45–$3.57 and free cash flow conversion of 95% of adjusted net income.
| The period guided | Low | High | The date it was given | |
|---|---|---|---|---|
| Revenue Growth | Year to Dec 2026 | 4.5% | 6.5% | 2026-07-30 |
| Currency | Year to Dec 2026 | 1.0% | 1.0% | 2026-07-30 |
| Organic growth | Year to Dec 2026 | 1.0% | 3.0% | 2026-07-30 |
| Adjusted EBITDA | Year to Dec 2026 | 2,130 | 2,190 | 2026-07-30 |
| Adjusted EPS | Year to Dec 2026 | 3.45 | 3.57 | 2026-07-30 |
| Free Cash Flow to Adj. Net Income conversion | Year to Dec 2026 | 95.0% | 95.0% | 2026-07-30 |
What this means. The percentages for the first and second halves are management’s estimate of how the full-year amount will be split, not growth rates.
Has Ingersoll Rand kept its past promises?
IR’s record is mixed, earning a 3/5 assessment. Organic growth finished above guidance in two of the four years checked and below it in two. The company reduced parts of its revenue, organic-growth and EBITDA guidance during 2024 and 2025. Acquisitions and currency can explain reported growth, but not an organic-growth miss. That leaves the next question: whether analysts believe the promised recovery will produce better earnings.
| What management forecast | Checked | Above | Within | Below |
|---|---|---|---|---|
| Revenue - Total Ingersoll Rand | 4 years | 3 | 1 | 0 |
| Ingersoll Rand (Organic) | 4 years | 2 | 0 | 2 |
| Adjusted EBITDA | 4 years | 3 | 0 | 1 |
What this means. The three out of five score does not match the three forecast rows, because each row is checked over four years and the table does not explain how the overall score is calculated.
What is Ingersoll Rand's revenue and profit trend?
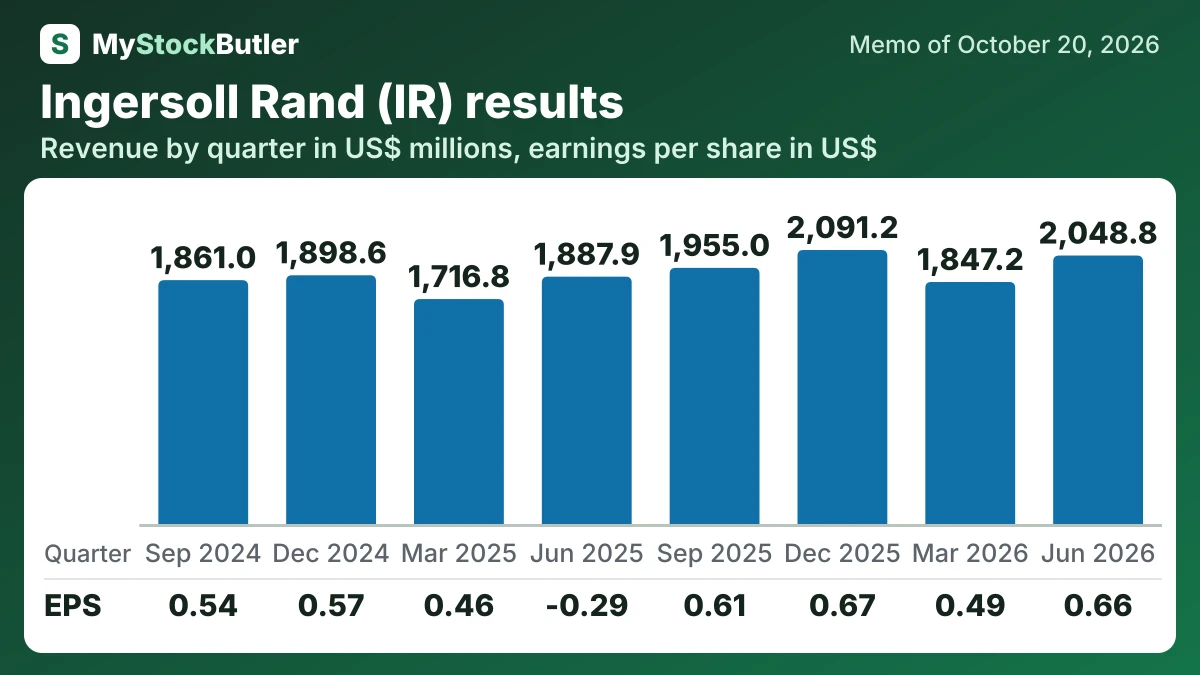
June 2026 showed real sales recovery, but unusual prior-year charges made the earnings rebound look far larger than the operating improvement.
Adjusted profitability tells the same quieter story. Adjusted EBITDA margin fell from 27.0% to 25.4%. Cash from operations improved, and lower capital spending supported free cash flow, but first-half free cash flow was slightly below the previous year. Management’s report that delayed long-cycle orders converted in July supports a timing explanation for some ITS weakness.
| Jun 2026 | Mar 2026 | Dec 2025 | Sep 2025 | Jun 2025 | Mar 2025 | Dec 2024 | Sep 2024 | |
|---|---|---|---|---|---|---|---|---|
| Revenue | 2,048.8 | 1,847.2 | 2,091.2 | 1,955.0 | 1,887.9 | 1,716.8 | 1,898.6 | 1,861.0 |
| Gross margin | 42.1% | 42.9% | 42.6% | 43.7% | 43.7% | 44.6% | 42.9% | 43.8% |
| Operating income | 380.3 | 289.7 | 390.2 | 375.5 | 76.4 | 302.5 | 378.8 | 356.3 |
| Net income | 256.8 | 192.1 | 266.1 | 244.1 | -115.3 | 186.5 | 229.8 | 221.6 |
| EPS, diluted | 0.66 | 0.49 | 0.67 | 0.61 | -0.29 | 0.46 | 0.57 | 0.54 |
What this means. The company's adjusted free cash flow can be higher because it excludes cash taxes related to selling businesses; we include those taxes because cash really left the company.