Haleon earnings: guidance and results
MyStockButler's October 2026 analysis: Haleon reported first-half revenue of £5,602m, gross margin of 65.9%, operating income of £1,172m and net income of £762m. The next release should show whether the second-quarter improvement continued.
What has Haleon guided for the year?
Haleon offers modest upside over three years, but the outcome hinges on earnings recovery, savings and cash generation holding up as volume and mix improve. Management guides FY2026 organic revenue growth of 3.0%–5.0% and high-single-digit adjusted operating-profit growth at constant currency. Its medium-term plan targets annual organic growth of 4.0%–6.0% and annual gross-margin expansion, supported by productivity savings.
| Period | Low | High | Given on | |
|---|---|---|---|---|
| Organic revenue growth (%) | FY2026 | 3.0% | 5.0% | Jul 30, 2026 |
| Adjusted operating profit growth at constant currency | FY2026 | High single digit | High single digit | Jul 30, 2026 |
| Net interest (£m) | FY2026 | 255 | 255 | Jul 30, 2026 |
| Adjusted effective tax rate (%) | FY2026 | 24.5% | 24.5% | Jul 30, 2026 |
| Share buybacks (£m) | FY2026 | 500 | 500 | Feb 25, 2026 |
| Annualised gross cost savings from the operating model (£m) | FY2026–FY2027 | 175 | 200 | Jul 30, 2026 |
Has Haleon kept its past promises?
Delivery has been mixed. Haleon’s organic sales growth in 2025 fell below its 4–6% medium-term ambition, while organic operating-profit growth exceeded its high-single-digit ambition. Annual bonuses paid below half their maximum, showing that higher profit did not automatically produce the highest reward.
What is Haleon’s eight-quarter revenue and profit trend?
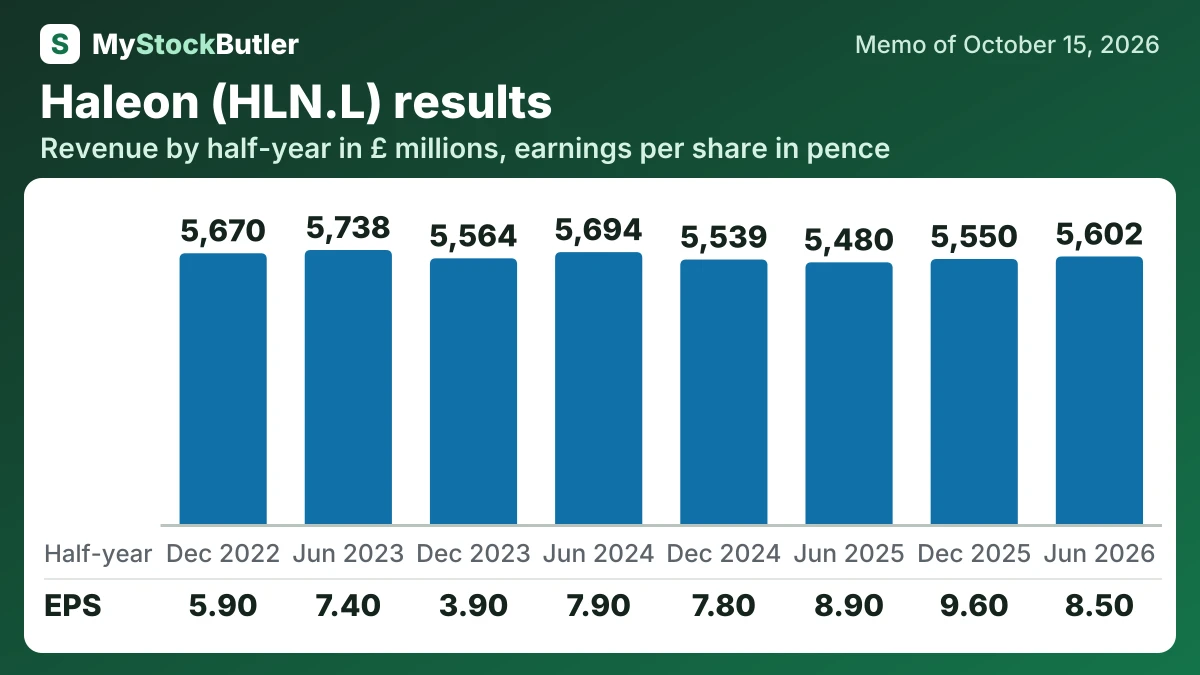
The first-half income statement was less encouraging. Revenue was £5,602m and gross margin reached 65.9%, yet operating income fell to £1,172m and net income to £762m. Restructuring cost £169m before tax, so removing it would make the earnings trend look much stronger.
| 6 months to Jun 2026 | 6 months to Dec 2025 | 6 months to Jun 2025 | 6 months to Dec 2024 | 6 months to Jun 2024 | 6 months to Dec 2023 | 6 months to Jun 2023 | 6 months to Dec 2022 | |
|---|---|---|---|---|---|---|---|---|
| Revenue | 5,602 | 5,550 | 5,480 | 5,539 | 5,694 | 5,564 | 5,738 | 5,670 |
| Operating income | 1,172 | 1,209 | 1,203 | 1,055 | 1,151 | 855 | 1,141 | 925 |
| Net income | 762 | 861 | 806 | 716 | 726 | 362 | 687 | 543 |
| EPS, diluted | 8.50 | 9.60 | 8.90 | 7.80 | 7.90 | 3.90 | 7.40 | 5.90 |
| Cash from operations | 1,044 | 1,607 | 1,027 | 1,459 | 842 | 1,351 | 749 | 1,383 |
| = Free cash flow | 697 | 1,130 | 674 | 1,077 | 486 | 945 | 360 | 960 |
What this means. Free cash flow here also subtracts lease payments and interest paid, not just money spent on equipment, buildings, and software.
What should investors watch in Haleon’s next release?
The first question is whether the second-quarter improvement continued. North America matters because management expects stronger growth there, while emerging markets provide much of the momentum. The statement mainly tests the third quarter, however, whereas management expects cold-and-flu demand to help in the fourth. Better toothpaste sales and a better flu season are separate routes to growth.