GPC stock forecast 2027–2029
MyStockButler's October 2026 analysis: GPC’s probability-weighted price is $119.91 in October 2027, $122.93 in October 2028 and $123.61 in October 2029. It hinges on cash recovery and an orderly separation.
Where could GPC's shares be by 2029?
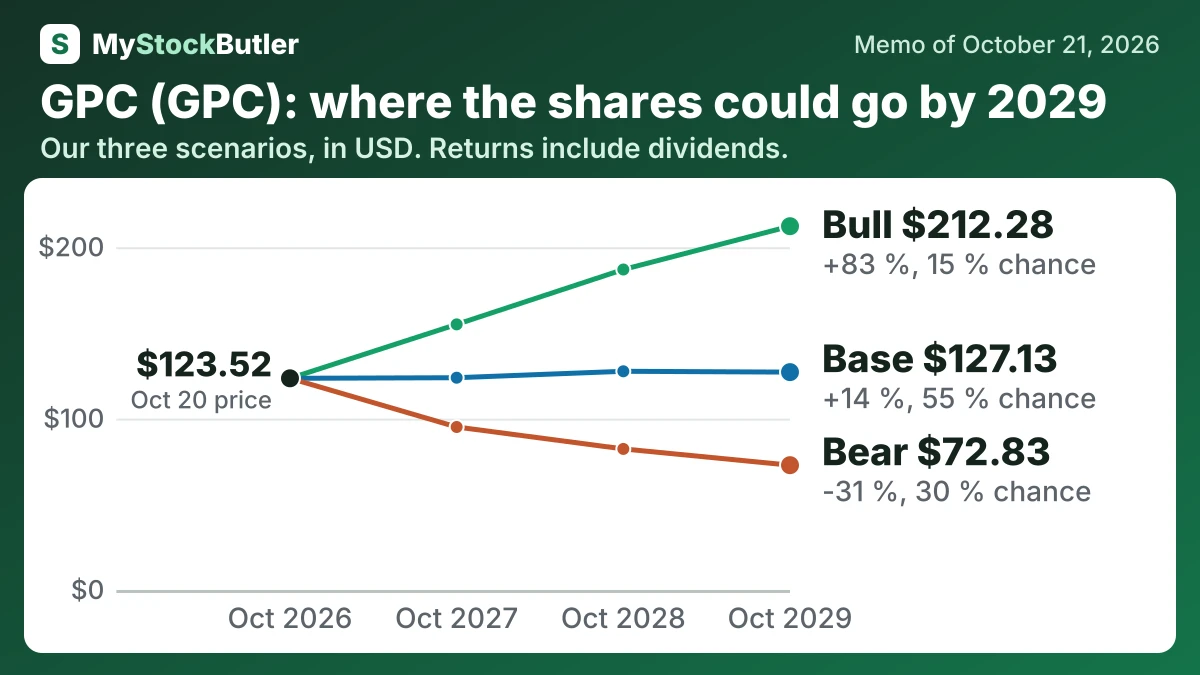
The forecast points to limited expected appreciation, but with substantial downside and upside dispersion. The probability-weighted price is $119.91 in October 2027, implying a 1% total return with dividends. It reaches $122.93 in October 2028 and $123.61 in October 2029, or 7% and 11% respectively.
| Case | Probability | October 2027 | October 2028 | October 2029 |
|---|---|---|---|---|
| Bear | 30 % | 95.11 (-20 %) | 82.31 (-26 %) | 72.83 (-31 %) |
| Base | 55 % | 123.87 (+4 %) | 127.62 (+10 %) | 127.13 (+14 %) |
| Bull | 15 % | 154.99 (+29 %) | 187.01 (+59 %) | 212.28 (+83 %) |
| Weighted | 100 % | 119.91 (+1 %) | 122.93 (+7 %) | 123.61 (+11 %) |
What has to go right—or wrong—for GPC?
The bear case begins with price-led Automotive growth failing to produce stronger unit demand. Motion then slows with factory activity, while labor, freight and separation costs prevent margin recovery. Cash remains tight, buybacks do not resume and investors apply a declining multiple. The price is $95.11 in 2027 and $72.83 in 2029. Its 30% probability reflects the documented margin decline, refinancing needs and separation risk, balanced by Motion’s growth and recurring replacement demand.
The bull case requires commercial automotive demand, inventory availability and Motion’s value-added services to improve together. Savings must outpace labor and freight inflation, while a clean separation clarifies debt and overhead and releases cash for buybacks and dividends. The price reaches $154.99 in 2027 and $212.28 in 2029. Its 15% probability reflects the number of interdependent successes required.
How much cash does GPC really make?
- Inventory and cash conversion. Broad stock supports availability but ties up cash. Inventory grew 10.1% in 2025 while sales grew 3.5%. GPC’s real free cash flow, computed as cash from operations minus capital spending and stock-based compensation, fell to 1.5% of revenue.
| 2025 | 2024 | 2023 | 2022 | 2021 | |
|---|---|---|---|---|---|
| Real free cash flow per share | 2.67 | 4.61 | 6.14 | 7.65 | 6.70 |
| Free cash flow per share | 3.02 | 4.90 | 6.54 | 7.92 | 6.88 |
| − Dividends paid, per share | 4.05 | 3.97 | 3.73 | 3.48 | 3.23 |
| Stock pay per share | 0.35 | 0.29 | 0.41 | 0.27 | 0.18 |
What this means. The company's free cash flow per share is higher because it does not subtract the value of shares given to employees as pay.
What are investors paying for GPC today?
At the October 20, 2026 closing price of $123.52, the shares traded at about 16.4 times trailing adjusted earnings. P/E means the share price divided by annual earnings per share; here, the earnings figure was approximately $7.54 for the twelve months through September 2026. Using reported earnings instead produced just $0.26 per share and a P/E near 475.