Generac stock forecast 2027–2029
MyStockButler's November 2026 analysis: Generac's probability-weighted price is $260.93 in November 2027. It hinges on turning a large backlog into profitable cash.
Where could Generac's shares be by November 2029?
The probability-weighted price is $260.93 in November 2027, a 32% return including dividends. It reaches $276.18 in November 2028, a 40% return. By November 2029, it is $278.62, a 41% return. The 2029 range runs from $110.20 to $522.56. Today's share price is $197.93.
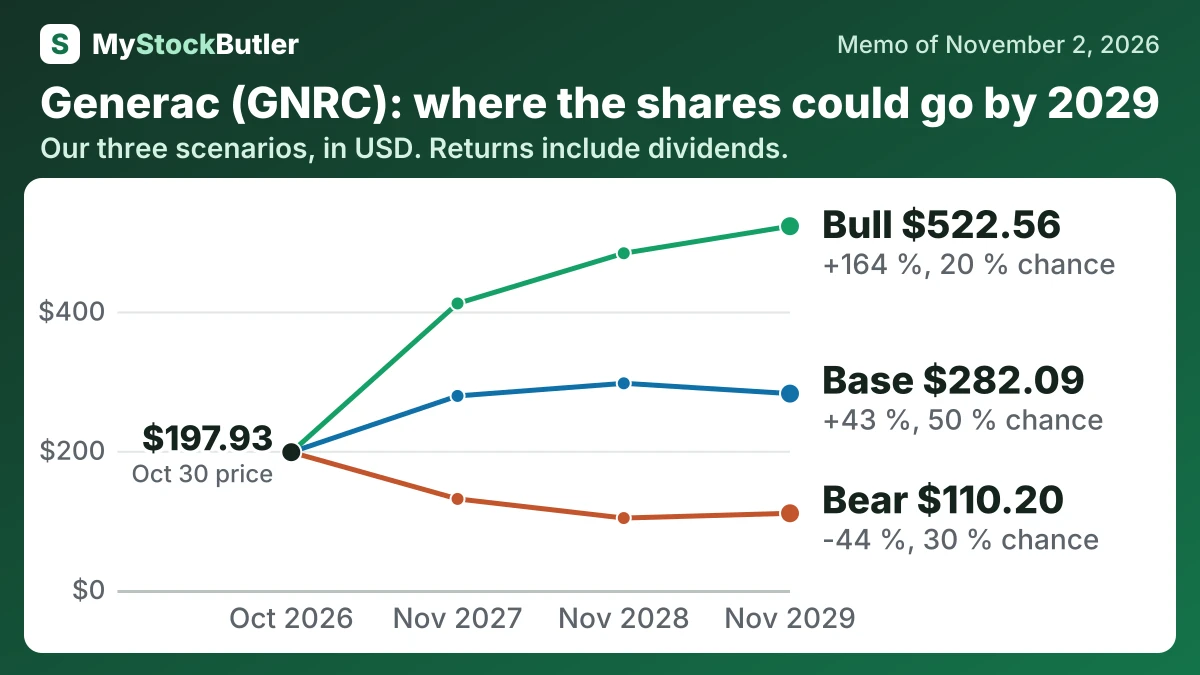
| Case | Probability | November 2027 | November 2028 | November 2029 |
|---|---|---|---|---|
| Bear | 30 % | 130.81 (-34 %) | 103.34 (-48 %) | 110.20 (-44 %) |
| Base | 50 % | 278.74 (+41 %) | 296.88 (+50 %) | 282.09 (+43 %) |
| Bull | 20 % | 411.58 (+108 %) | 483.72 (+144 %) | 522.56 (+164 %) |
| Weighted | 100 % | 260.93 (+32 %) | 276.18 (+40 %) | 278.62 (+41 %) |
What this means. The weighted value is a probability-based average, not a promise that the shares will reach that price.
What has to go right or wrong for Generac?
The earnings path is a recovery toward, and then above, Generac's historical operating level. The base case uses $744 million in November 2027, $850 million in November 2028 and $875 million in November 2029. Those figures follow sales of $6.2 billion, $6.8 billion and $7.0 billion at margins near the five-year average of 12.1%. The $4.5 billion data-center backlog and $2.4 billion Amazon programme support the ramp, while engine shortages and lower-margin data-center work limit it.
The bear case falls to $504 million, $459 million and $513 million as deliveries slip, residential demand fades and utilization weakens. The bull case reaches $858 million, $1.064 billion and $1.218 billion because capacity fills, engines arrive and residential installations keep pace. The bull margins rise above history only because strong utilization offsets mix pressure.
How much cash does Generac really make?
Free cash flow is cash from operations after capital spending. It fell to $268.13 million in 2025 from $604.57 million in 2024. The difference largely reflects working capital: 2024 released $216.96 million, while 2025 tied up $13.12 million. In 2022, working capital absorbed $448.33 million, helping push free cash flow below zero; in 2023, a $128.39 million release helped it recover.
| 2025 | 2024 | 2023 | 2022 | 2021 | |
|---|---|---|---|---|---|
| Cash from operations | 437,978 | 741,301 | 521,670 | 58,516 | 411,156 |
| Of which, freed from working capital | 216,964 | 128,389 | |||
| Of which, tied up in working capital | 13,123 | 448,325 | 226,736 | ||
| − Capital spending | 169,850 | 136,733 | 129,060 | 86,188 | 109,992 |
| = Free cash flow | 268,128 | 604,568 | 392,610 | -27,672 | 301,164 |
| − Stock pay | 49,947 | 49,248 | 35,492 | 29,481 | 23,954 |
| = Real free cash flow | 218,181 | 555,320 | 357,118 | -57,153 | 277,210 |
| Free cash flow — the company's own count | 268,128 | 604,568 | 395,904 | -24,106 | 305,773 |
| What its own count adds back | 3,294 | 3,566 | 4,609 | ||
| Free cash flow, % of revenue | 6.4% | 14.1% | 9.8% | -0.6% | 8.1% |
| Real free cash flow, % of revenue | 5.2% | 12.9% | 8.9% | -1.3% | 7.4% |
What this means. The company's own free cash flow is higher because it counts money raised by selling rights to some customer payments, while our count leaves that financing out.
What does an investor pay for Generac today?
P/E means share price divided by earnings per share. The trailing version uses the past year, while the forward version uses an estimate for the next year. Imagine a shop earning $5 per share now but expecting $14 next year. The price has not changed; only the denominator has. So a low forward P/E is a bet on recovery, not proof that the stock is cheap.
| Today (Nov 2, 2026) | |
|---|---|
| Share price | 197.93 |
| Market value (calculated) | 11,675,565.70 |
| Enterprise value (calculated) | 12,615,506.70 |
| P/E, last 12 months (calculated) | 39.2x |
| P/E, next 12 months (calculated) | 14.2x |
| EV / revenue, last 12 months (calculated) | 2.7x |
| Price to book (calculated) | 3.9x |
| Free cash flow yield (calculated) | 2.3% |
| Real free cash flow yield (calculated) | 1.9% |
| Dividend yield (calculated) | 0.0% |
What this means. The report is dated November 2, but the share price is actually the closing price from October 30.