F5 stock forecast 2027–2029
MyStockButler's October 2026 analysis: F5's weighted forecast reaches $354.93 in October 2027 and $394.43 in October 2029, below today's $459.36. It hinges on recurring software growth and new demand offsetting the expected refresh fade.
Where could F5's shares be by 2029?
The weighted forecast puts F5 below today’s $459.36 at every date. It reaches $354.93 in October 2027 and $373.09 in October 2028. By October 2029, it reaches $394.43, a 14% loss including dividends.
The 2029 range is $241.42 to $612.23. Today’s price is $459.36. The forecast assigns 30% to the bear case, 55% to the base case and 15% to the bull case.
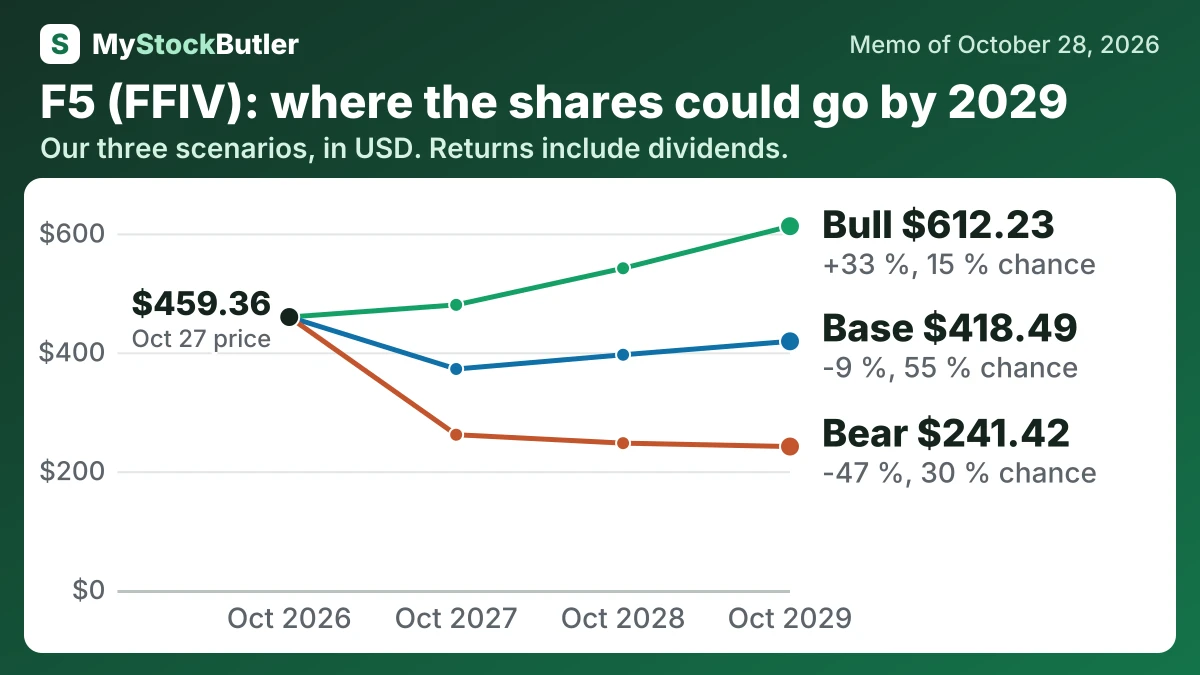
| Case | Probability | October 2027 | October 2028 | October 2029 |
|---|---|---|---|---|
| Bear | 30 % | 261.30 (-43 %) | 247.13 (-46 %) | 241.42 (-47 %) |
| Base | 55 % | 371.93 (-19 %) | 395.89 (-14 %) | 418.49 (-9 %) |
| Bull | 15 % | 479.86 (+4 %) | 541.43 (+18 %) | 612.23 (+33 %) |
| Weighted | 100 % | 354.93 (-23 %) | 373.09 (-19 %) | 394.43 (-14 %) |
What has to go right for F5, and what could go wrong?
The bear case requires the replacement cycle to fade before subscriptions and new deployments can replace it. Higher component costs and security concerns then weaken earnings and the P/E. The path leads to $261.30 in October 2027 and $241.42 in October 2029. Its probability is 30% because roughly two-thirds of recent systems business came from replacements, although net cash and the installed base limit the chance of a permanent collapse.
The base case assumes management delivers its outlook, while software, services and buybacks partly offset slower systems growth. It leads to $371.93 in 2027 and $418.49 in 2029. Its 55% probability reflects the guidance record, but the final value remains below today’s price because the multiple falls.
The bull case requires AI demand, platform adoption, recurring growth and margin expansion to succeed together. It leads to $479.86 in 2027 and $612.23 in 2029. Its probability is 15% because SaaS and managed-services revenue was still only $182 million, while AI bookings are not yet recognized revenue.
How much cash does F5 really make?
| Sep 2026 | Sep 2025 | Sep 2024 | Sep 2023 | Sep 2022 | |
|---|---|---|---|---|---|
| Cash from operations | 959,489 | 949,666 | 792,419 | 653,409 | 442,631 |
| − Capital spending | 90,545 | 43,260 | 30,412 | 54,184 | 33,624 |
| = Free cash flow | 868,944 | 906,406 | 762,007 | 599,225 | 409,007 |
| − Stock pay | 261,013 | 231,491 | 219,108 | 236,650 | 249,216 |
| = Real free cash flow | 607,931 | 674,915 | 542,899 | 362,575 | 159,791 |
| Real free cash flow, % of revenue | 17.8% | 21.9% | 19.3% | 12.9% | 5.9% |
What this means. The company's own free cash flow is almost the same as ours; the small differences are only because it rounds its figures to whole millions.
What does an investor pay for F5 today?
| Today (Oct 28, 2026) | |
|---|---|
| Share price | 459.36 |
| Market value (calculated) | 26,096,700.96 |
| P/E, last 12 months (calculated) | 36.7x |
| P/E, next 12 months (calculated) | 25.5x |
| Free cash flow yield (calculated) | 3.3% |
| Real free cash flow yield (calculated) | 2.3% |
What this means. The share price is labeled today, but it is the closing price from October 27, while the share count is from September 30.