Erie Indemnity earnings
MyStockButler's October 2026 analysis: In the September 2026 quarter, Erie Indemnity reported revenue of $1.1 billion, operating income of $207.4 million, net income of $182.0 million and diluted EPS of $3.48 versus $3.50. The next release should show whether Erie Indemnity's falling policy count and weaker retention persist.
What has Erie Indemnity guided for 2026?
Erie issues no standing quarterly or annual earnings guidance. It set the 2026 management-fee rate at 25% and guided to a $7 million company share of 2026 net pension benefit expense. Around results, it missed the first-quarter analyst forecast, then beat the next two; the latest EPS beat was $3.48 versus $3.41.
| Period guided | Low | High | Date given | |
|---|---|---|---|---|
| Management fee rate (%) | Year to Dec 2026 | 25.0% | 25.0% | Dec 11, 2025 |
| Net pension benefit expense | Year to Dec 2026 | 18 | 18 | Feb 23, 2026 |
| Our share of the net pension benefit expense | Year to Dec 2026 | 7 | 7 | Feb 23, 2026 |
What this means. The company’s total net pension benefit expense is 18 million dollars, while our count is 7 million dollars because we include only the company’s share of that pension amount.
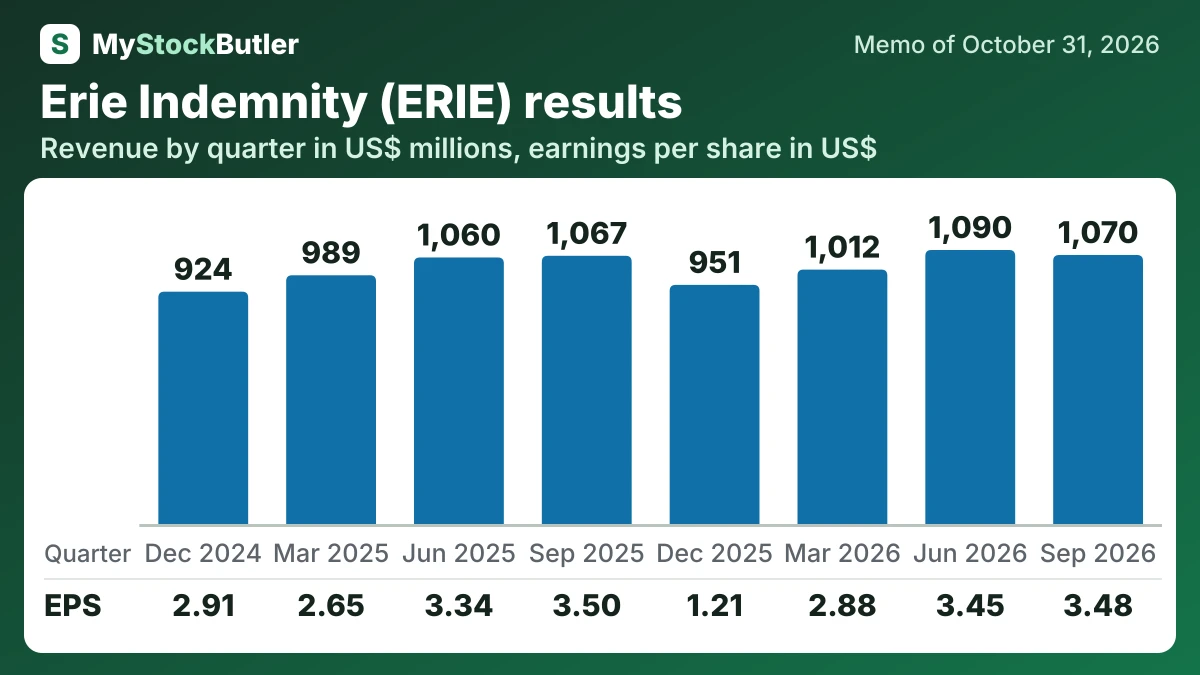
What were Erie Indemnity's last eight quarters of revenue and profit?
Revenue reached $1.1 billion, versus $1.1 billion in the September 2025 quarter, while operating income slipped to $207.4 million and net income to $182.0 million. Diluted earnings per share were $3.48, compared with $3.50. The small earnings decline matters because it accompanied weaker underlying volume: written premiums grew 1.8%, average premium per policy rose 5.4% and policies in force fell 1.9%.
| Sep 2026 | Jun 2026 | Mar 2026 | Dec 2025 | Sep 2025 | Jun 2025 | Mar 2025 | Dec 2024 | |
|---|---|---|---|---|---|---|---|---|
| Revenue | 1,069,917 | 1,089,796 | 1,011,911 | 951,023 | 1,066,739 | 1,060,097 | 989,399 | 924,090 |
| Gross margin | 19.4% | 18.7% | 16.5% | 16.6% | 19.6% | 18.8% | 15.3% | 18.1% |
| Operating margin | 19.4% | 18.7% | 16.5% | 16.6% | 19.6% | 18.8% | 15.3% | 18.1% |
| EPS, diluted | 3.48 | 3.45 | 2.88 | 1.21 | 3.50 | 3.34 | 2.65 | 2.91 |
| Free cash flow | 185,370 | 173,403 | 54,478 | 140,790 | 184,412 | 157,319 | 88,444 | 146,815 |
What this means. Gross margin and operating margin are the same here because the report includes administrative costs in the costs used for both measures.
What should I watch in Erie Indemnity's next release?
The Exchange’s combined ratio reached 105% for the quarter as catastrophe losses increased, although the nine-month ratio improved. Weather can blur the underlying trend, but the falling policy count and weaker retention deserve attention beyond one storm-affected period.