Erie Indemnity stock forecast 2027–2029
MyStockButler's October 2026 analysis: Erie Indemnity's weighted price is $257.62 in October 2027, with a 1% total return including dividends. Erie Indemnity's outcome turns on policy retention, service costs, underwriting and technology productivity.
Where could Erie Indemnity's shares be by 2029?
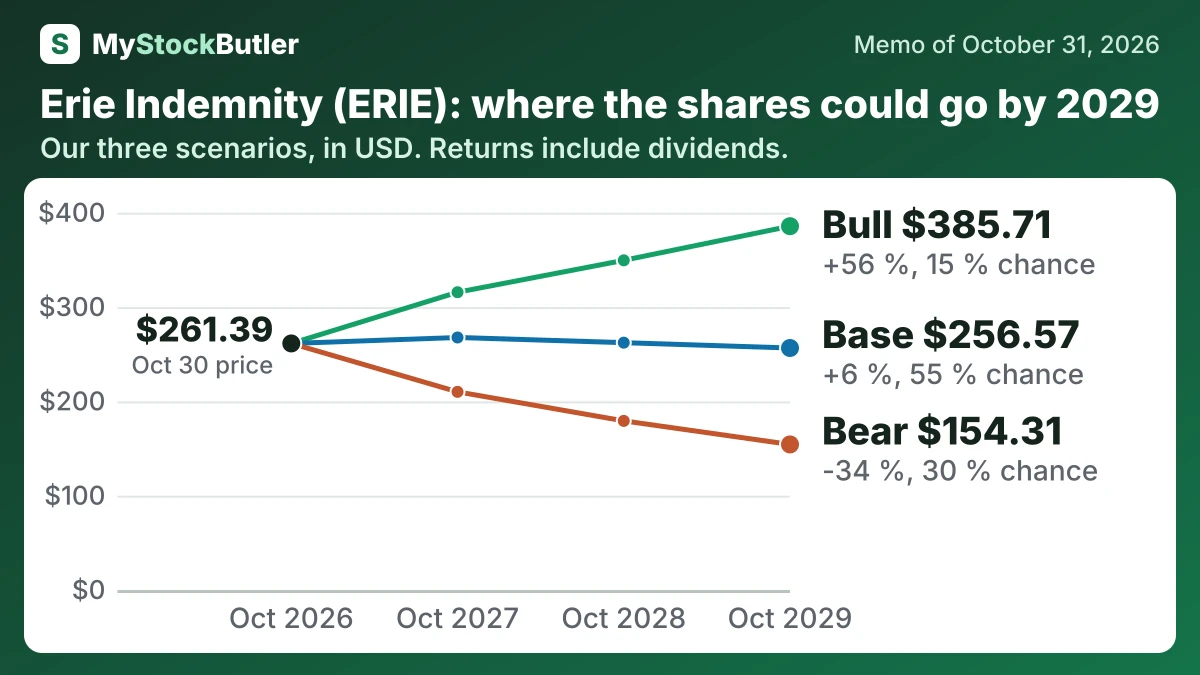
By October 2029, the bear case reaches $154.31 and the bull case reaches $385.71, against today’s $261.39. The probabilities are 30% bear, 55% base and 15% bull, so stability is the central expectation rather than strong appreciation or collapse.
| Case | Probability | October 2027 | October 2028 | October 2029 |
|---|---|---|---|---|
| Bear | 30 % | 210.07 (-17 %) | 179.29 (-27 %) | 154.31 (-34 %) |
| Base | 55 % | 267.72 (+5 %) | 262.22 (+5 %) | 256.57 (+6 %) |
| Bull | 15 % | 315.71 (+23 %) | 349.53 (+39 %) | 385.71 (+56 %) |
| Weighted | 100 % | 257.62 (+1 %) | 250.44 (+1 %) | 245.26 (+1 %) |
What this means. The weighted row is the probability-based average of the bear, base, and bull cases, so it can be lower than the base case because the bear case has a larger probability than the bull case.
What could make Erie Indemnity's forecast rise or fall?
Base earnings rise from $667 million to $706 million as premium growth remains modest and normalized margins stay stable. The bear case falls from $610 million to $577 million because policy losses offset pricing and service costs compress margins. The bull case rises from $688 million to $776 million as policy stabilization, better Exchange underwriting and technology productivity lift revenue and margins.
| October 2027 | October 2028 | October 2029 | |
|---|---|---|---|
| Earnings | 667 (610 / 688) | 686 (586 / 731) | 706 (577 / 776) |
| Shares (millions) | 52.30 (52.31 / 52.30) | 52.30 (52.32 / 52.30) | 52.30 (52.33 / 52.30) |
| Dividends per share | 6.27 (5.85 / 6.38) | 6.71 (5.85 / 6.95) | 7.19 (5.85 / 7.58) |
| Price to earnings | 21.00 (18.00 / 24.00) | 20.00 (16.00 / 25.00) | 19.00 (14.00 / 26.00) |
What this means. The price to earnings number shows how many dollars investors pay for each dollar the company earns.
How much cash does Erie Indemnity really make?
Free cash flow was $571.0 million after $115.7 million of capital spending. Subtracting $4.0 million of stock pay produces the analytical figure called real free cash flow. Stock pay is not a cash payment in that period, but it still compensates employees and can dilute owners, so the deduction highlights its economic cost.
| 2025 | 2024 | 2023 | 2022 | 2021 | |
|---|---|---|---|---|---|
| Cash from operations | 686,657 | 611,249 | 381,205 | 366,152 | 402,794 |
| − Capital spending | 115,692 | 124,845 | 92,647 | 67,204 | 148,800 |
| = Free cash flow | 570,965 | 486,404 | 288,558 | 298,948 | 253,994 |
| − Stock pay | 4,040 | 9,489 | 12,247 | 5,000 | 4,000 |
| = Real free cash flow | 566,925 | 476,915 | 276,311 | 293,948 | 249,994 |
| Real free cash flow, % of revenue | 13.9% | 12.6% | 8.5% | 10.3% | 9.5% |
What this means. Real free cash flow subtracts stock pay even though some cash-paid awards were already counted in cash from operations, so this subtraction is not all additional cash spending.
What does an investor pay for Erie Indemnity today?
At the current price, the forward estimate implies $12.69 of earnings per share over the next twelve months, compared with $11.03 over the last twelve months. That is roughly a 15% increase, but part of it may come from the foundation contribution leaving the comparison rather than from equivalent operating improvement.