Cincinnati Financial stock forecast 2027–2029
MyStockButler's October 2026 analysis: Cincinnati Financial's weighted scenario is $173.55 in October 2029, a 5% gain including dividends. It hinges on renewal pricing staying ahead of claim costs.
Where could Cincinnati Financial's shares be by 2029?
The weighted price is $160.85 in October 2027, a 7% decline including dividends. It is $173.55 in October 2029, a 5% gain including dividends. Bear has 27% probability; base has 53%. Bull has 20%.
The probability-weighted price is $160.85 in October 2027, or a 7% loss from $177.31 today after including dividends. It is $166.52 in October 2028, a 2% loss, before reaching $173.55 in October 2029, a 5% gain. The final range is wide: $68.02 in the bear case to $287.34 in the bull case.
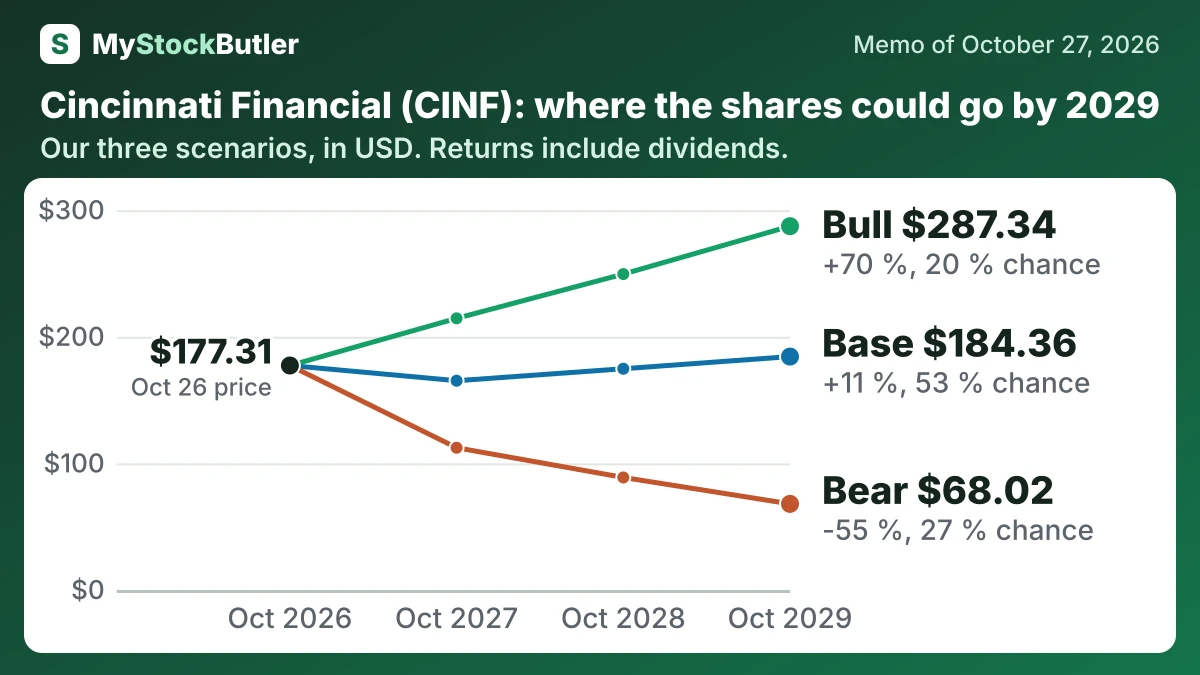
| Case | Probability | October 2027 | October 2028 | October 2029 |
|---|---|---|---|---|
| Bear | 27 % | 112.34 (-35 %) | 88.88 (-46 %) | 68.02 (-55 %) |
| Base | 53 % | 165.29 (-5 %) | 174.76 (+3 %) | 184.36 (+11 %) |
| Bull | 20 % | 214.57 (+23 %) | 249.52 (+45 %) | 287.34 (+70 %) |
| Weighted | 100 % | 160.85 (-7 %) | 166.52 (-2 %) | 173.55 (+5 %) |
What this means. The weighted row is the average expected share price after giving each case more or less weight based on its probability.
What has to go right, and what could go wrong for Cincinnati Financial?
The bear case falls to $1,150 million, $1,050 million and $950 million. It applies an initial haircut and then assumes weaker casualty margins, higher reserves or heavier catastrophes. The bull case reaches $1,550 million, $1,700 million and $1,850 million, requiring strong pricing, profitable retention, agency productivity and rising investment income. The base case is supported by 2025 core earnings of $1,254 million and management’s 92%–98% through-cycle combined-ratio target.
How much does Cincinnati Financial really earn and give back?
Investment income supplies the second engine. In 2025, underwriting income was $501 million and investment income was $1.2 billion. Interest and dividends are different from gains caused by changing security prices, so a strong stock market can lift net income without proving that new policies were well priced.
| 2025 | 2024 | 2023 | 2022 | 2021 | |
|---|---|---|---|---|---|
| Net premiums earned | 9,983 | 8,889 | 7,958 | 7,225 | 6,478 |
| Combined ratio (under 100% = underwriting profit) | 94.9% | 93.4% | 94.9% | 98.1% | 88.3% |
| Underwriting income | 501 | 580 | 401 | 140 | 731 |
| Investment income | 1,165 | 1,025 | 894 | 781 | 714 |
| Return on equity (net income divided by average shareholders' equity) | 16.0% | 17.6% | 16.3% | -4.2% | 25.7% |
What does an investor pay for Cincinnati Financial today?
The different P/E measures show why the stock can look cheap and expensive at once. A P/E tells us how many dollars investors pay for one dollar of annual earnings. Cincinnati’s reported trailing P/E is much lower than its core trailing and forward P/Es because those measures use earnings intended to reflect the insurance operation more consistently.
| Today (Oct 27, 2026) | |
|---|---|
| Share price | 177.31 |
| P/E, last 12 months (calculated) | 10.4x |
| P/E on core earnings, last 12 months (calculated) | 18.2x |
| P/E, next 12 months (calculated) | 20.8x |
| Price to book (calculated) | 1.7x |
| Dividend yield (calculated) | 2.1% |