Dollar Tree earnings
MyStockButler's October 2026 analysis: Dollar Tree's next results are expected on November 24, 2026. Watch whether temporary financial help becomes durable operating progress.
What has Dollar Tree guided for fiscal 2026?
For fiscal 2026, the year ending in January 2027, Dollar Tree guides to sales of $20,500 million–$20,700 million and adjusted earnings per share of $7.70–$8.05. Adjusted earnings remove items management identifies as unusual. Comparable-store growth measures improvement at established stores, so it tests the existing business rather than merely counting new locations. At the quarter ended August 1, 2026, Dollar Tree operated 9,436 stores.
| Period guided | Low | High | Date given | |
|---|---|---|---|---|
| Sales - Dollar Tree (US$ millions) | Fiscal 2026 (year to Jan 2027) | 20,500.0 | 20,700.0 | Aug 27, 2026 |
| Comparable Sales - Dollar Tree | Fiscal 2026 (year to Jan 2027) | 3.0% | 4.0% | Aug 27, 2026 |
| Adjusted Diluted Earnings per Share | Fiscal 2026 (year to Jan 2027) | 7.70 | 8.05 | Aug 27, 2026 |
| Capital Expenditures | Fiscal 2026 (year to Jan 2027) | 1,100.0 | 1,200.0 | Aug 27, 2026 |
What this means. The table mixes the latest one-year forecast with longer-term growth targets, so the growth algorithm is an expected yearly growth rate, not a forecast of total earnings per share.
Did Dollar Tree keep its promises?
The promise deserves a 4/5 for reliability. Comparable forecasts were met or exceeded, though some language softened and the record is not a complete eight-quarter numerical series.
| What management forecast | Checked | Above | Within | Below |
|---|---|---|---|---|
| Net sales | 6 quarters | 1 | 5 | 0 |
| Adjusted diluted EPS | 6 quarters | 4 | 2 | 0 |
| Comparable store net sales growth — Dollar Tree | 5 quarters | 3 | 2 | 0 |
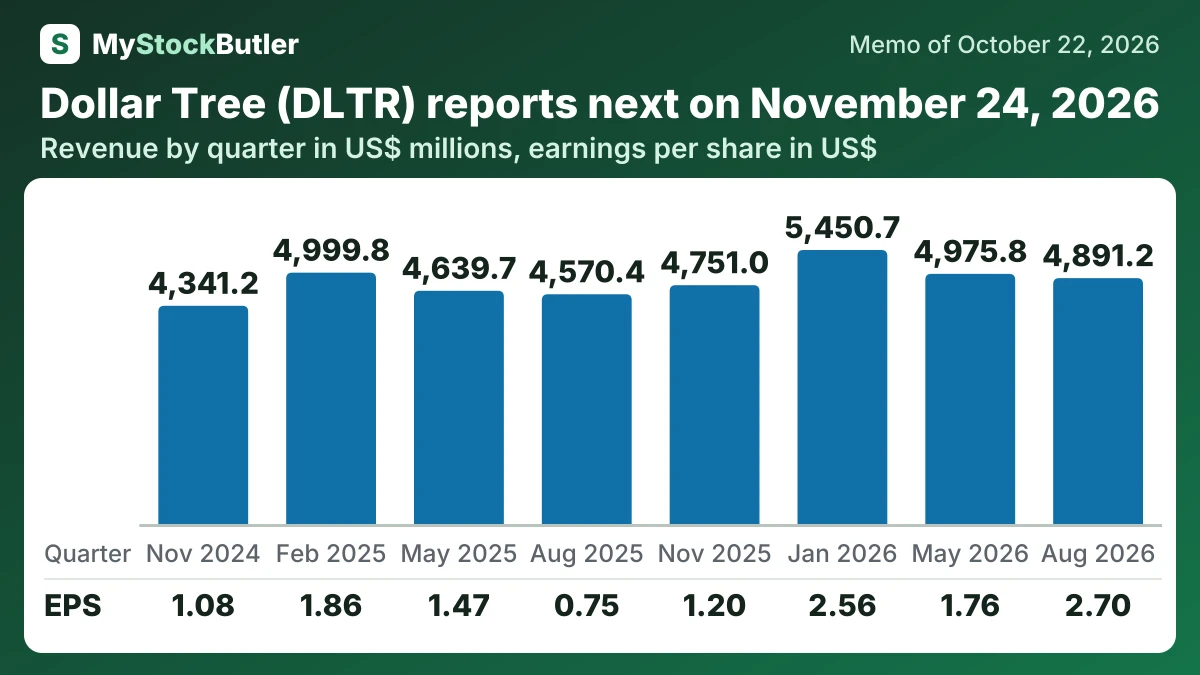
What do Dollar Tree's last eight quarters show?
In January 2026, gross profit was $7,050.7 million and gross margin was 36.3%. Operating margin rose from 8.3% to 8.5%, so expenses absorbed much of the gross-margin improvement. January 2023 had a 37.5% gross margin and $2,099.3 million of operating profit; the latest operating profit was $1,653.1 million despite higher revenue.
| Aug 2026 | May 2026 | Jan 2026 | Nov 2025 | Aug 2025 | May 2025 | Feb 2025 | Nov 2024 | |
|---|---|---|---|---|---|---|---|---|
| Revenue | 4,891.2 | 4,975.8 | 5,450.7 | 4,751.0 | 4,570.4 | 4,639.7 | 4,999.8 | 4,341.2 |
| Operating income | 690.1 | 473.3 | 694.7 | 343.3 | 231.0 | 384.1 | 533.6 | 330.7 |
| Net income | 514.5 | 347.3 | 511.7 | 244.6 | 155.5 | 313.5 | 400.2 | 232.3 |
| EPS, diluted | 2.70 | 1.76 | 2.56 | 1.20 | 0.75 | 1.47 | 1.86 | 1.08 |
What this means. Free cash flow can be negative even when the business brings in cash, because buying equipment and buildings can cost more than its day-to-day cash earnings.
What should people watch in Dollar Tree's next results?
The next milestones must reveal whether temporary financial help becomes durable operating progress.