Camden earnings date
MyStockButler's October 2026 analysis: Camden's next results are expected on November 5, 2026. Watch whether Camden stays within guidance.
What has Camden guided for 2026?
Management guides to 2026 same-property revenue growth of 0.0%–1.0% and expense growth of 2.0%–3.0%. That implies same-property NOI growth of -1.7%–0.5%. On July 30, 2026, it put full-year Core FFO at $6.68–$6.82 per diluted share.
| Period guided | Low | High | Date given | |
|---|---|---|---|---|
| Core FFO per diluted share | Year to Dec 2026 | 6.68 | 6.82 | Jul 30, 2026 |
| Core FFO per diluted share | Quarter to Sep 2026 | 1.67 | 1.71 | Jul 30, 2026 |
| Same Property Growth Guidance — Revenues | Year to Dec 2026 | 0.0% | 1.0% | Jul 30, 2026 |
| Same Property Growth Guidance — Expenses | Year to Dec 2026 | 2.0% | 3.0% | Jul 30, 2026 |
| Same Property Growth Guidance — NOI | Year to Dec 2026 | -1.7% | 0.5% | Jul 30, 2026 |
What this means. The earnings per share forecast includes a one-time profit from selling California properties, while funds from operations leaves out that property-sale profit, so the two forecasts are not directly comparable.
Did Camden keep its past promises?
Management’s delivery record is strong for recurring operations but not perfect for every accounting measure. Core FFO beat or met guidance across the checked quarters, while FFO and comparable EPS had some misses. Camden also cut its annual FFO midpoint from $6.61 to $6.10 in April while keeping Core FFO at $6.75. That revision is why the record earns a good, rather than perfect, assessment.
| What management forecast | Checked | Above | Within | Below |
|---|---|---|---|---|
| EPS | 7 quarters | 1 | 3 | 3 |
| FFO | 7 quarters | 3 | 3 | 1 |
| Core FFO | 7 quarters | 4 | 3 | 0 |
What this means. The property-profit figure includes earnings belonging to other owners who may convert their holdings into shares, so it is not all the profit belonging to ordinary shareholders.
What is Camden's last eight-quarter trend?
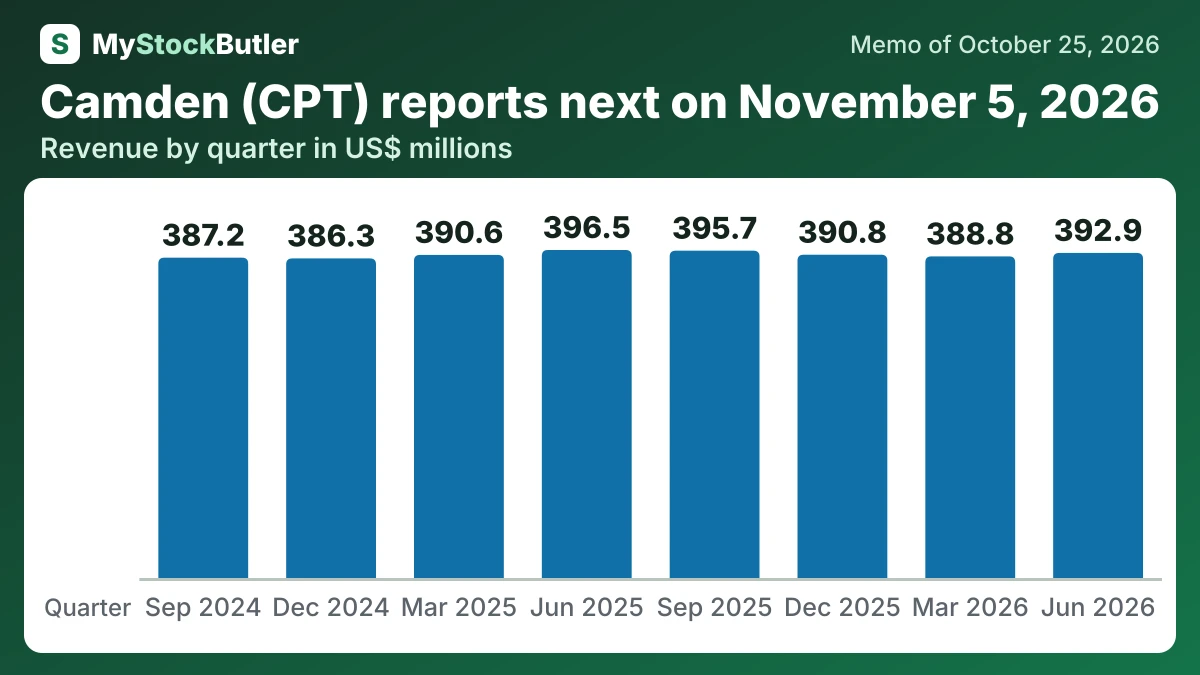
The eight-quarter pattern shows little sustained expansion. Revenue and NOI moved within narrow ranges, while per-share results were helped by fewer shares. Core AFFO per share fell as the dividend rose, pushing the payout higher.
| Jun 2026 | Mar 2026 | Dec 2025 | Sep 2025 | Jun 2025 | Mar 2025 | Dec 2024 | Sep 2024 | |
|---|---|---|---|---|---|---|---|---|
| Revenue | 392,944 | 388,773 | 390,794 | 395,676 | 396,509 | 390,565 | 386,319 | 387,232 |
| Net operating income | 252,000 | 248,704 | 252,872 | 249,980 | 252,837 | 251,145 | 248,308 | 243,872 |
| FFO per share | 1.68 | 1.15 | 1.73 | 1.67 | 1.67 | 1.70 | 1.68 | 1.65 |
| AFFO per share (company's measure) | 1.39 | 1.55 | 1.46 | 1.43 | 1.43 | 1.58 | 1.46 | 1.48 |
| AFFO payout ratio | 76.3% | 68.4% | 71.9% | 73.4% | 73.4% | 66.5% | 70.5% | 69.6% |
| Occupancy | 95.6% | 95.0% | 95.1% | 95.5% | 95.6% | 95.3% | 95.2% | 95.4% |
What this means. Occupancy is the average share of apartments occupied during the quarter, not the share occupied on the final day.
What should I watch in Camden's next results?
Camden planned to release third-quarter results on November 5, 2026, followed by its call on November 6. Those results should show whether performance stayed within guidance, how much debt remained after the California sale and whether South Charlotte’s lease-up accelerated. Those tests matter more than the sale-driven jump in EPS.