CF earnings date and guidance
MyStockButler's October 2026 analysis: CF's next results are expected on November 4, 2026. The key watch is whether July orders became delivered product and cash.
What has CF guided for 2026?
Management expects 9.5 million tons of gross ammonia production in 2026. 2026 capital expenditure guidance is $1,300 million. That includes $550 million for the existing network and $600 million for the Blue Point joint venture. Production forecasts were met or exceeded in three of five years. Capital forecasts were met in one of four.
| Period guided | Low | High | Date given | |
|---|---|---|---|---|
| Gross ammonia production (million tons) | Year to Dec 2026 | 9.5 | 9.5 | Aug 5, 2026 |
| Capital expenditures for full year 2026 | Year to Dec 2026 | 1,300 | 1,300 | Aug 5, 2026 |
| Activities within the Company’s existing network | Year to Dec 2026 | 550 | 550 | Aug 5, 2026 |
| Total estimated capital expenditures of the Blue Point One joint venture | Year to Dec 2026 | 600 | 600 | Aug 5, 2026 |
| Capital expenditures related to its wholly owned Blue Point common facilities | Year to Dec 2026 | 150 | 150 | Aug 5, 2026 |
| Capital expenditures for CF Industries, excluding the portion of capital expenditures funded by JERA and Mitsui | Year to Dec 2026 | 950 | 950 | Aug 5, 2026 |
What this means. The Blue Point One joint venture’s total planned spending is 600 million dollars because the company funds 240 million and its partners fund 360 million.
Did CF keep its past promises?
| What management forecast | Checked | Above | Within | Below |
|---|---|---|---|---|
| Gross ammonia production | 5 years | 1 | 2 | 2 |
| Capital expenditures | 4 years | 1 | 0 | 3 |
What this means. The company met only three of its five forecasts, so two forecasts were missed.
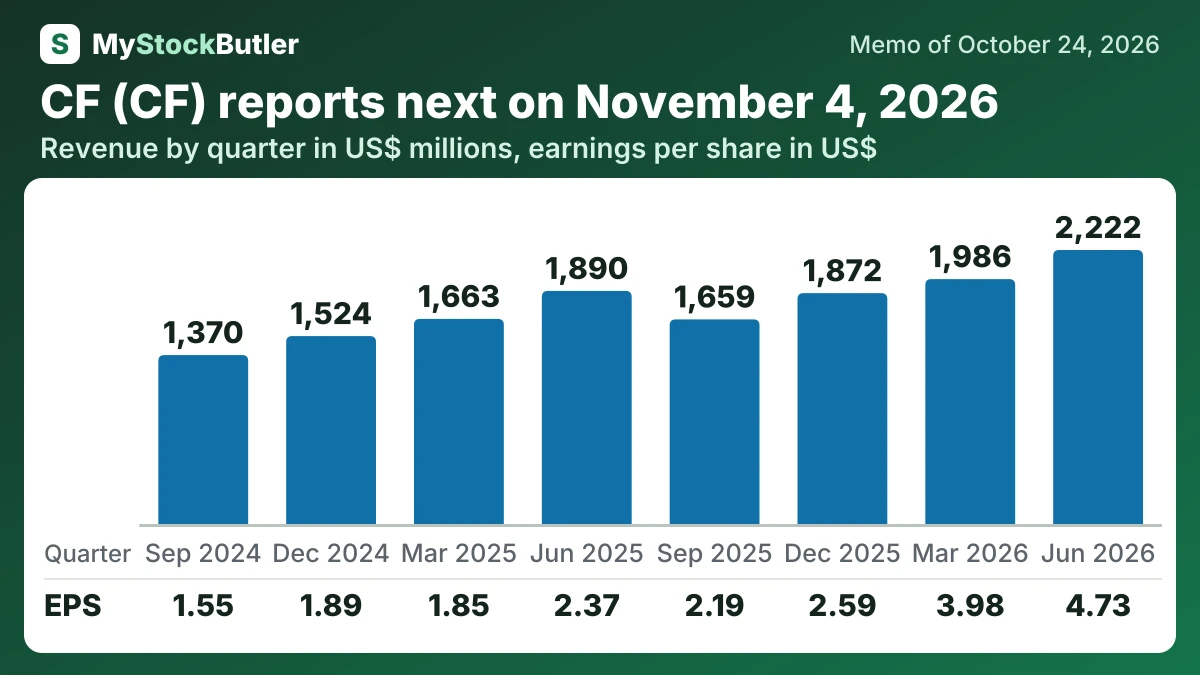
How have CF revenue and profit trended?
Revenue rose 17.6% in the June 2026 quarter, while gross margin reached 51.5%. Shipments nevertheless fell 15%. Higher realized prices, especially for granular urea, drove the improvement rather than greater volume. That is a genuine improvement in trading conditions, but not evidence of stronger production.
| Jun 2026 | Mar 2026 | Dec 2025 | Sep 2025 | Jun 2025 | Mar 2025 | Dec 2024 | Sep 2024 | |
|---|---|---|---|---|---|---|---|---|
| Revenue | 2,222 | 1,986 | 1,872 | 1,659 | 1,890 | 1,663 | 1,524 | 1,370 |
| Gross margin | 51.5% | 37.6% | 40.9% | 38.1% | 39.9% | 34.4% | 34.4% | 32.4% |
| Operating income | 1,121 | 863 | 617 | 580 | 648 | 455 | 441 | 364 |
| Net income | 727 | 615 | 404 | 353 | 386 | 312 | 328 | 276 |
| EPS, diluted | 4.73 | 3.98 | 2.59 | 2.19 | 2.37 | 1.85 | 1.89 | 1.55 |
| = Free cash flow | 607 | 273 | 313 | 717 | 318 | 454 | 223 | 792 |
What this means. The September 2025 and September 2024 cash figures are calculated by subtracting earlier periods, because the company did not report those three-month amounts separately.
What should CF watch for next?
Sales volume fell 15% year over year and about 9% even after excluding lost Yazoo City availability. Customers slowed purchases in June, then placed strong July orders extending into November. Orders are not shipments, so the next quarter must show whether that demand became delivered product and cash.