CF dividend: payout and cash coverage
MyStockButler's October 2026 analysis: CF pays $2.40 per share in the base forecast, after the quarterly dividend rose to $0.60 on July 8, 2026. In 2025, CF's $1.802 billion of free cash flow covered the shareholder payout, although payments to all owners exceeded the consolidated figure.
How much does CF pay in dividends?
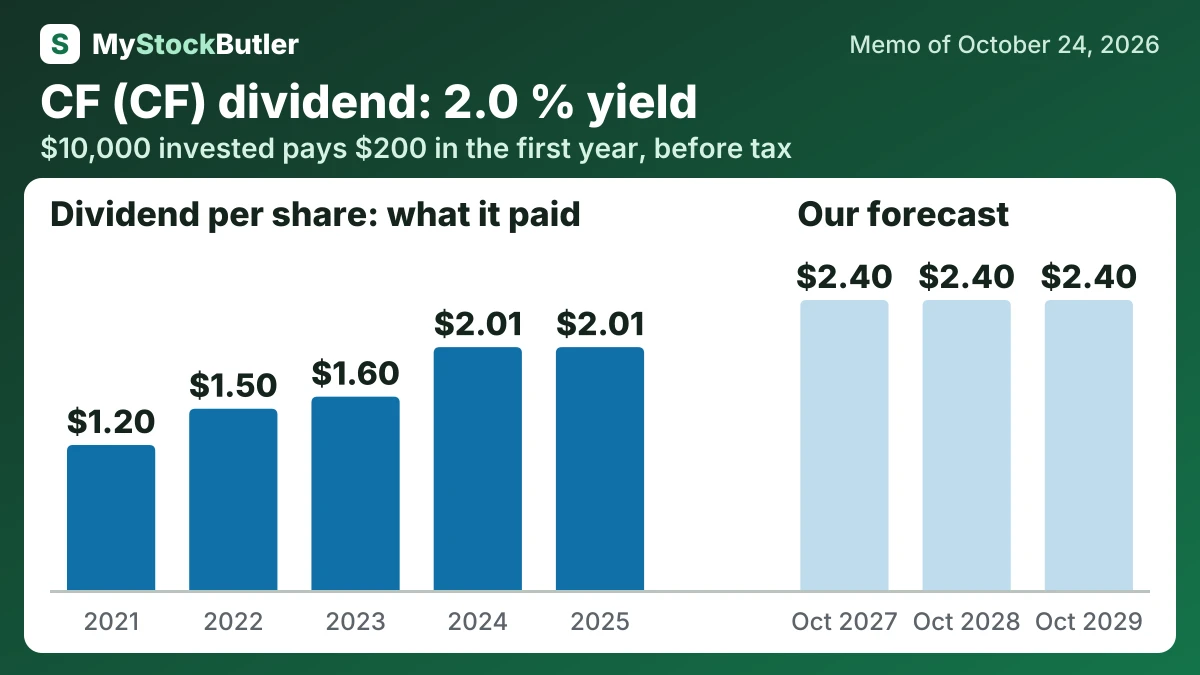
Debt reduction was meaningful but uneven. Net debt ended 2025 at $1.233 billion, below $1.837 billion in 2021 but above $642 million in 2022. Buybacks were the largest discretionary distribution: 2025 repurchases reduced outstanding shares by approximately 10% from the previous year-end. The board authorized another $2 billion program on May 6, 2025, and the quarterly dividend rose to $0.60 on July 8, 2026.
The base dividend remains $2.40 per share throughout. The July 2026 increase supports that rate, while recent free cash flow supports continued payment. The bear case cuts the dividend after the first year; the bull case raises it after the first year. The absence of a stated growth target and the $1,300 million capital-spending plan argue for stability rather than automatic increases.
| 2025 | 2024 | 2023 | 2022 | 2021 | |
|---|---|---|---|---|---|
| − Paid to minority owners, per share | 1.87 | 1.70 | 2.37 | 3.03 | 0.90 |
| − Dividends paid, per share | 2.01 | 2.01 | 1.60 | 1.50 | 1.20 |
| − Share buybacks, per share | 8.42 | 8.35 | 2.99 | 6.60 | 2.49 |
What this means. The company's own free cash flow per share is lower than ours because it subtracts cash paid to outside part-owners, while our count includes that cash.
How much would CF's dividend pay you?
$10,000 invested in CF at its 2.0% dividend yield (our report of October 24, 2026) pays $200.00 in the first year, before tax. If its dividend per share keeps changing 13.8% a year, as it did from 2021 to 2025, and the dividends are reinvested, year 10 pays $872.46, with $4,539.66 received in all.
Before tax. Past dividend growth is not a promise. Information only, not investment advice.
Is CF's dividend covered by its cash?
The distribution policy remained aggressive. In 2024, payments to shareholders exceeded that year’s free cash flow. In 2025, the shareholder payout was below free cash flow, but payments to all owners still exceeded the consolidated figure. Cash nevertheless rose because borrowing and other balance-sheet inflows supplied additional money.
Operating cash flow was $2.752 billion in 2025. After $950 million of capital spending, free cash flow was $1.802 billion. Subtracting $45 million of stock compensation gives an analytical “real free cash flow” figure, because stock awards dilute owners even though they do not require the same immediate cash payment as wages.
| 2025 | 2024 | 2023 | 2022 | 2021 | |
|---|---|---|---|---|---|
| Free cash flow | 1,802 | 1,753 | 2,258 | 3,402 | 2,359 |
| − Dividends paid | 326 | 364 | 311 | 306 | 260 |
| − Share buybacks | 1,365 | 1,509 | 580 | 1,347 | 539 |
| = Free cash flow not paid out | 908 | 1,130 | 1,366 | ||
| = Paid out more than the free cash flow | 193 | 428 |
What this means. The company's free cash flow is higher than our real free cash flow because we also count stock-based pay to employees as a cost.
What could change CF's dividend?
Management expects 9.5 million tons of gross ammonia production in 2026. 2026 capital expenditure guidance is $1,300 million. That includes $550 million for the existing network and $600 million for the Blue Point joint venture. Production forecasts were met or exceeded in three of five years. Capital forecasts were met in one of four.
| October 2027 | October 2028 | October 2029 | |
|---|---|---|---|
| Normal operating profit | 2,475 (1,495 / 3,237) | 2,336 (1,700 / 3,400) | 2,294 (1,890 / 3,567) |
| Dividends per share | 2.40 (2.40 / 2.40) | 2.40 (2.00 / 2.80) | 2.40 (1.60 / 3.20) |
| Enterprise value to normal operating profit | 6.00 (5.00 / 6.50) | 6.00 (5.25 / 7.00) | 6.00 (5.50 / 7.50) |
| Net debt | 626 (1,310 / -34.00) | -265 (728 / -1,756) | -1,122 (-66.00 / -3,452) |
What this means. The negative net debt numbers mean the company has more cash than borrowed money.