CCEP earnings: guidance and results
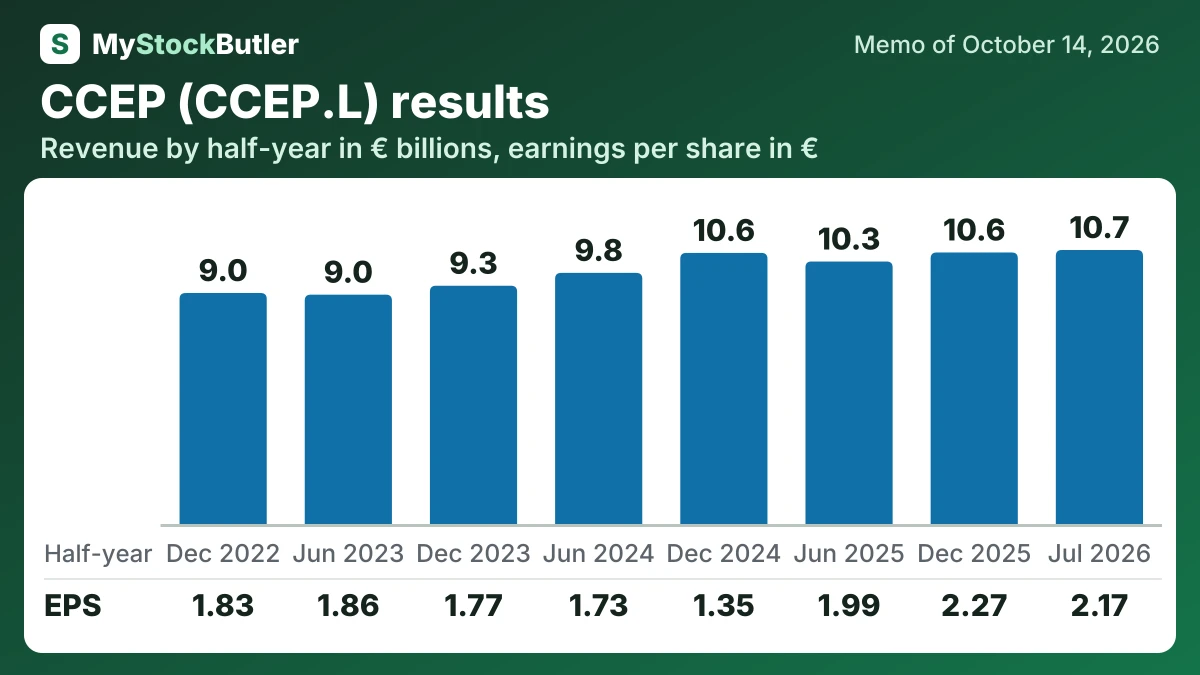
MyStockButler's October 2026 analysis: CCEP's latest half-year revenue reached €10,724 million, while operating income and shareholder profit also rose. The next release should test volume, revenue per case and profit confidence together.
What has CCEP guided for 2026?
For 2026, management guides to comparable, currency-neutral revenue growth of 3.0%–4.0% and operating-profit growth of 7.0%. It expects comparable free cash flow of at least €1,700 million, capital expenditure including leases of 5.0% of revenue, a 50.0% dividend payout ratio and €1,000 million of buybacks.
| Period | Low | High | Given on | |
|---|---|---|---|---|
| Revenue growth (%) | Year to Dec 2026 | 3.0% | 4.0% | Aug 4, 2026 |
| Operating profit growth (%) | Year to Dec 2026 | 7.0% | 7.0% | Aug 4, 2026 |
| CAPEX (% of revenue, including leases) | Year to Dec 2026 | 5.0% | 5.0% | Aug 4, 2026 |
| Comparable free cash flow (EUR millions) | Year to Dec 2026 | 1,700 | Aug 4, 2026 | |
| Dividend payout ratio (%) | Year to Dec 2026 | 50.0% | 50.0% | Aug 4, 2026 |
| Share buyback (EUR millions) | Year to Dec 2026 | 1,000 | 1,000 | Aug 4, 2026 |
Did CCEP keep its past promises?
The 2023 LTIP, measured through 2025, vested at 1.33 times target. Earnings per share and return on invested capital each counted for 42.5% of the award, while emissions reduction counted for 15%. Financial performance therefore outweighed the fact that CO₂e performance missed its target.
What were CCEP's latest results, and how did the last eight reported periods trend?
Revenue reached €10,724 million, compared with €10,274 million a year earlier. Operating income and shareholder profit also rose, even though gross margin slipped slightly. The improvement was therefore not simply a broad expansion of the margin on drinks.
| 6 months to Jul 2026 | 6 months to Dec 2025 | 6 months to Jun 2025 | 6 months to Dec 2024 | 6 months to Jun 2024 | 6 months to Dec 2023 | 6 months to Jun 2023 | 6 months to Dec 2022 | |
|---|---|---|---|---|---|---|---|---|
| Revenue | 10,724 | 10,627 | 10,274 | 10,610 | 9,828 | 9,325 | 8,977 | 9,040 |
| Operating income | 1,458 | 1,429 | 1,364 | 990 | 1,142 | 1,169 | 1,170 | 1,119 |
| Net income | 967 | 1,029 | 913 | 621 | 797 | 815 | 854 | 841 |
| EPS, diluted | 2.17 | 2.27 | 1.99 | 1.35 | 1.73 | 1.77 | 1.86 | 1.83 |
What this means. Free cash flow here is lower because this report also subtracts lease payments and interest paid, not just spending on equipment, buildings, and software.
What should investors watch in CCEP's next release?
The immediate checkpoint is the Q3 trading update on 3 November 2026. Investors should examine volume, revenue per case and profit confidence together. Mix matters because more large supermarket bottles may add litres without producing the same revenue per litre as individually sold cold drinks.