BXP earnings: guidance and next results
MyStockButler's October 2026 analysis: BXP’s next results are expected on January 26, 2027. The key thing to watch for BXP is whether occupied space, not merely signed space, starts producing cash.
What has BXP guided for the year?
On October 27, 2026, management guided to full-year FFO per diluted share of $7.06–$7.08. Average in-service occupancy is guided to 88.8%–89.3%. Same-property NOI is stronger on an accounting basis than on a cash basis; cash NOI guidance is -0.3% to 0.3%.
| Period guided | Low | High | Date given | |
|---|---|---|---|---|
| Projected FFO per share (diluted) | Full Year 2026 | 7.06 | 7.08 | Oct 27, 2026 |
| Average In-service portfolio occupancy | Full Year 2026 | 88.8% | 89.3% | Oct 27, 2026 |
| Change in BXP’s Share of Same Property net operating income - cash (excluding termination income) | Full Year 2026 | -0.3% | 0.3% | Oct 27, 2026 |
What this means. The 88.8%–89.3% occupancy forecast is the average for 2026, while the 89% occupied and 91% leased figures are targets for the end of the year, so they measure different things.
Has BXP kept its past promises?
The guidance record is mixed in the way that matters: FFO has generally been cautious, but EPS has been more exposed to impairments tied to planned sales. Faster lease commencements could support recurring FFO in 2027, while sale gains and write-downs could still make EPS swing.
| What management forecast | Checked | Above | Within | Below |
|---|---|---|---|---|
| EPS (diluted) | 6 quarters | 4 | 0 | 2 |
| FFO per share (diluted) | 6 quarters | 5 | 1 | 0 |
How have BXP’s revenue and profit trended?
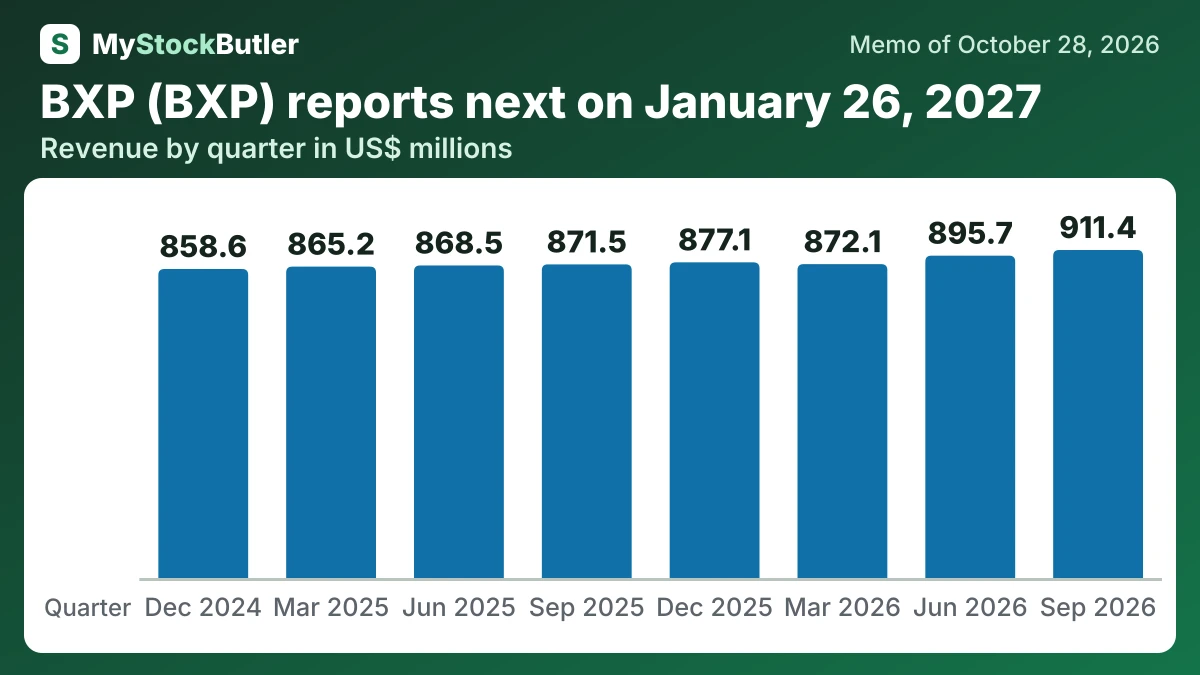
Revenue, NOI and FFO per diluted share all improved from the September 2025 quarter. FFO per diluted share exceeded the midpoint of quarterly guidance by $0.08. Net income also turned positive, but property gains and prior-period write-downs make it a poor measure of the operating turn.
| Sep 2026 | Jun 2026 | Mar 2026 | Dec 2025 | Sep 2025 | Jun 2025 | Mar 2025 | Dec 2024 | |
|---|---|---|---|---|---|---|---|---|
| Revenue | 911,431 | 895,699 | 872,148 | 877,097 | 871,510 | 868,457 | 865,215 | 858,571 |
| Net operating income | 552,377 | 538,655 | 506,007 | 515,763 | 517,008 | 514,080 | 511,798 | 512,430 |
| FFO per share | 1.89 | 1.78 | 1.59 | 1.76 | 1.74 | 1.71 | 1.64 | 1.79 |
| Occupancy | 89.4% | 88.4% | 87.4% | 86.7% | 86.0% | 86.4% | 86.9% | 87.5% |
What this means. The occupancy percentage covers only operating commercial properties and leaves out the company's hotels and residential properties.
What should BXP watch next?
Management’s next quarterly update should address how far 2027 occupancy may exceed its original 91% target. At September 30, 2026, roughly half of the 1.1 million square feet of signed but uncommenced leases was expected to start by year-end. Those commencements must be measured against 1.6 million square feet of 2027 expirations.
A possible Times Square Tower sale in the first quarter of 2027 could provide capital, but management expects it to reduce 2027 FFO by about six cents per share if it closes then. The Colorado Center loan comes due in summer 2027, while a major tenant departure makes refinancing harder.