BXP stock forecast 2027–2029
MyStockButler's October 2026 analysis: BXP’s weighted price is $54.25 in October 2027, an 8% loss including dividends, and reaches $60.59 in October 2029, an 11% gain including dividends. It hinges on lease commencements, refinancing, and development replacing income lost to sales.
Where could BXP’s shares be in each forecast year?
The forecast points to a modestly negative weighted outcome before a gradual recovery. The weighted price is $54.25 in October 2027, an 8% loss including dividends. It is $56.83 in October 2028, roughly flat including dividends. By October 2029, it reaches $60.59, an 11% gain including dividends.
The bear case has a 29% probability. The base case has a 53% probability. The bull case has an 18% probability. At the final date, the range runs from $29.56 to $103.75. Today’s price is $62.18.
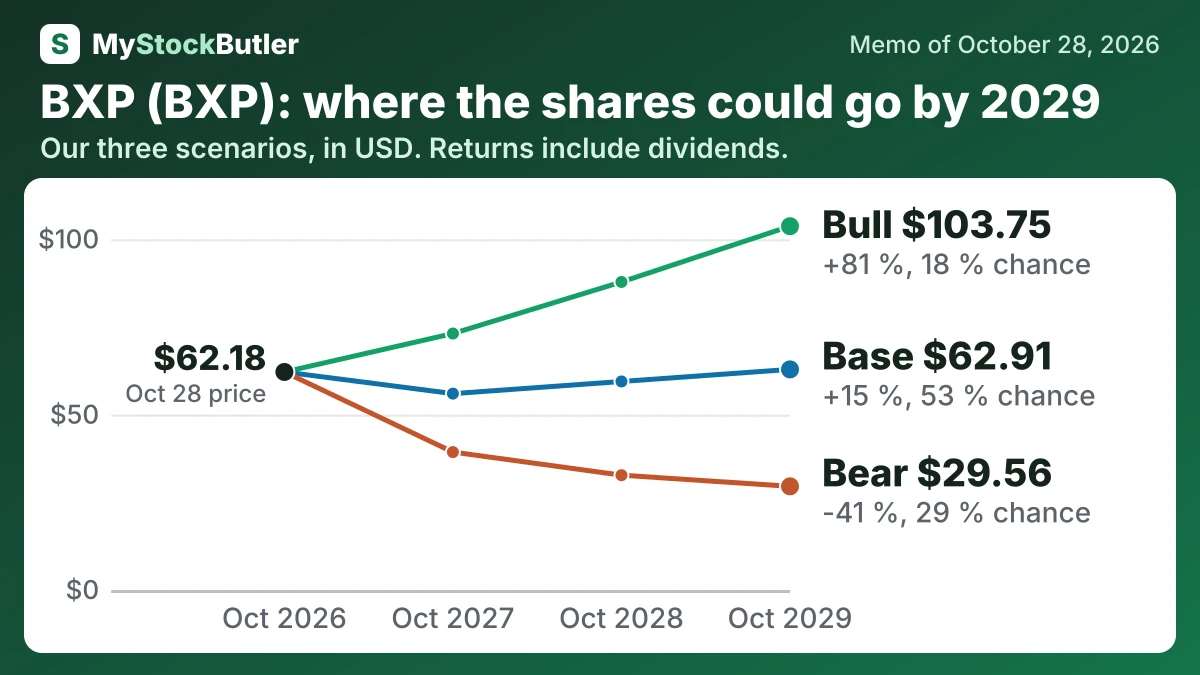
| Case | Probability | October 2027 | October 2028 | October 2029 |
|---|---|---|---|---|
| Bear | 29 % | 39.33 (-32 %) | 32.74 (-39 %) | 29.56 (-41 %) |
| Base | 53 % | 56.00 (-5 %) | 59.47 (+5 %) | 62.91 (+15 %) |
| Bull | 18 % | 73.14 (+22 %) | 87.85 (+51 %) | 103.75 (+81 %) |
| Weighted | 100 % | 54.25 (-8 %) | 56.83 (+0 %) | 60.59 (+11 %) |
What this means. The weighted row is the average value after giving each case its stated chance of happening.
What has to go right or wrong for BXP?
BXP’s weighted forecast points to an 8% loss by October 2027 and an 11% gain by October 2029, hinging on lease commencements, refinancing, and development replacing income lost to sales.
How much cash does BXP really make?
BXP calls its own measure funds available for distribution, or FAD. It starts with FFO and subtracts specified non-cash items, second-generation tenant improvements, leasing commissions and maintenance capital spending. FAD fell in 2025, while dividends paid provide only a rough comparison because the shareholder populations and timing must match. FAD also excludes some development, acquisition and repositioning spending.
| 2025 | 2024 | 2023 | 2022 | 2021 | |
|---|---|---|---|---|---|
| Dividends paid | 643,107 | 689,870 | 687,809 | 685,019 | 683,753 |
| Funds available for distribution to common shareholders and common unitholders (FAD) | 753,764 | 894,010 | 928,916 | 834,135 | 740,066 |
What this means. The company's funds available for distribution includes cash belonging to outside operating partnership unit holders, so it is not directly comparable with dividends paid to common shareholders.
What does an investor pay for BXP today?
FFO, or funds from operations, explains why the stock looks inexpensive. FFO adds back real-estate depreciation and removes property-sale gains, making recurring property operations easier to judge. BXP traded at 8.86 times FFO, an implied FFO yield of about 11.3%. Its forward P/E was about 26.3, partly because the 2026 EPS guidance midpoint of $2.36 excludes the economic effect of $5.02 in projected depreciation and amortization.
| Today (Oct 28, 2026) | |
|---|---|
| Share price | 62.18 |
| Market value (calculated) | 9,928,424.671 |
| Price to FFO (calculated) | 8.86x |
| Dividend yield (calculated) | 4.5% |
What this means. The market value is an estimate because it uses the number of shares reported on September 30, 2026, and leaves out units held outside the company.