Alexandria stock forecast 2027–2029
MyStockButler's October 2026 analysis: Alexandria’s weighted forecast reaches $34.25 in October 2029, implying a 4% loss including dividends. It hinges on lease-up, cash earnings and financing.
Where could Alexandria’s shares be by October 2029?
The range is unusually wide: the bear case reaches $12.61 by October 2029, while the bull case reaches $80.05, against today’s $43.40. The final probabilities are 40% bear, 48% base and 12% bull.
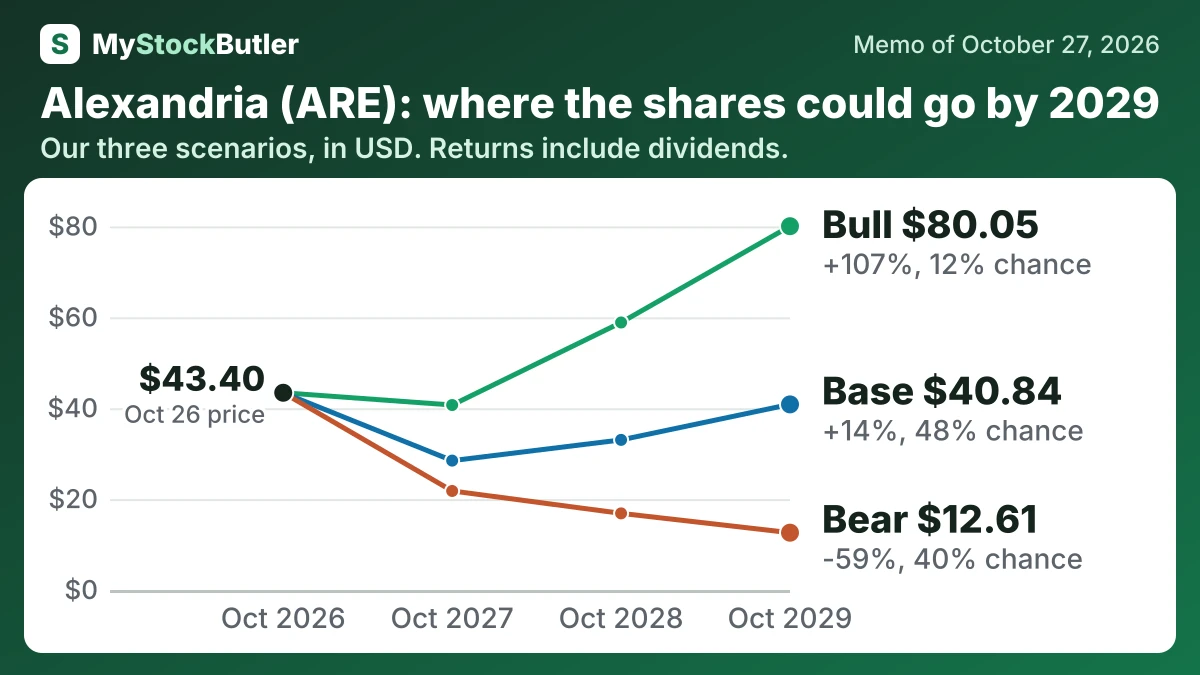
| Case | Probability | October 2027 | October 2028 | October 2029 |
|---|---|---|---|---|
| Bear | 40% | 21.79 (-45%) | 16.86 (-53%) | 12.61 (-59%) |
| Base | 48% | 28.47 (-28%) | 33.03 (-11%) | 40.84 (+14%) |
| Bull | 12% | 40.70 (+0%) | 58.86 (+50%) | 80.05 (+107%) |
| Weighted | 100% | 27.27 (-31%) | 29.67 (-20%) | 34.25 (-4%) |
What has to go right, and what could go wrong for Alexandria?
The base multiple expands from 5.5 times to 7.0 times as NOI improves, but remains well below Alexandria’s historical levels. The multiple had fallen to 6.4 times at the end of 2025 as FFO and confidence weakened. Bear valuation contracts from 4.5 times to 3.5 times because vacancy, leverage and asset sales persist. Bull valuation reaches 11.0 times if leasing economics and financing pressure improve. The table shows every selected operating, capital and valuation assumption.
How much cash does Alexandria really make?
Operating activities generated $1.4 billion in 2025, while dividends paid were $911.5 million. That left $502.6 million before investing, but additions to real estate consumed $1.9 billion. The calculation includes growth spending, not just maintenance, yet it shows that operations did not fund both the dividend and the building program.
| 2025 | 2024 | 2023 | 2022 | 2021 | |
|---|---|---|---|---|---|
| AFFO (company's measure) | 1,534,664 | 1,629,077 | 1,532,314 | 1,361,709 | 1,144,888 |
| AFFO per share (company's measure) | 9.01 | 9.47 | 8.97 | 8.42 | 7.76 |
| Dividends paid | 911,450 | 898,557 | 847,483 | 757,742 | 655,968 |
| AFFO payout ratio | 51.9% | 54.8% | 55.3% | 56.1% | 57.7% |
What this means. The company’s adjusted funds from operations does not subtract spending needed to maintain its properties, so it may look like more cash is available for dividends than there really is.
What does Alexandria’s stock price pay for today?
On October 27, 2026, the shares traded at $43.40 and 4.5 times FFO. FFO, or funds from operations, adds much property depreciation back to accounting earnings because depreciation does not directly measure a building’s changing market value. AFFO usually subtracts more recurring property costs, but companies define it differently. Neither measure equals cash ready to distribute: Alexandria may still need to pay for repairs, laboratory fit-outs, leasing commissions and interest.
| Today (Oct 27, 2026) | |
|---|---|
| Share price | 43.40 |
| Market value (calculated) | 7,558,571.993 |
| Price to FFO (calculated) | 4.5x |
| Price to AFFO (calculated) | 6.1x |
| Dividend yield (calculated) | 6.6% |
What this means. The price-to-funds-from-operations ratio looks cheaper because it includes a one-time gain from paying off debt, which is not normal ongoing profit.