BAT earnings
MyStockButler's October 2026 analysis: BAT's first half of 2026 brought better product growth and cash generation, but reported profit still fell. BAT's next release will test profitable repeat sales, delivered savings and cash conversion.
What has BAT guided for the year?
For 2026, management guides to revenue growth of 3.0–5.0% at constant exchange rates. Constant rates hold currencies unchanged so that exchange movements do not obscure the underlying business. Adjusted operating-profit growth is guided to 4.0–6.0%, while adjusted diluted earnings-per-share growth is guided to 5.0–8.0%. Adjusted figures remove items management treats as exceptional, and earnings per share divides profit among the shares outstanding.
Management’s broader ambition is more than £50bn of free cash flow before dividends through 2030. The affordability case therefore depends on cash remaining after dividends, legal payments and investment, alongside progress towards a 2.0–2.5x adjusted net-debt-to-adjusted-EBITDA range. EBITDA is earnings before interest, tax, depreciation and amortisation; the ratio compares debt with an earnings measure, not available cash.
| Period | Low | High | Given on | |
|---|---|---|---|---|
| Revenue growth at constant rates (%) | Year to Dec 2026 | 3.0% | 5.0% | Sep 29, 2026 |
| Adjusted profit from operations growth at constant rates, adjusted for Canada (%) | Year to Dec 2026 | 4.0% | 6.0% | Sep 29, 2026 |
| Adjusted diluted EPS growth at constant rates, adjusted for Canada (%) | Year to Dec 2026 | 5.0% | 8.0% | Sep 29, 2026 |
| Adjusted net debt/adjusted EBITDA, adjusted for Canada (x) | Year to Dec 2026 | 2.0x | 2.5x | Sep 29, 2026 |
Has BAT kept its past promises?
The record is not uniformly reassuring. BAT’s 2025 annual incentive paid 77.8% of its maximum, but the 2023–2025 long-term award paid nothing for several missed minimum targets. BAT also promised a £1.1 billion buyback programme for 2025 and reported expenditure of £1,112 million. Its promise of £700 million in annualised Fit2Win savings by 2028 remains ahead of proof: “annualised” means the yearly saving once the changes fully operate.
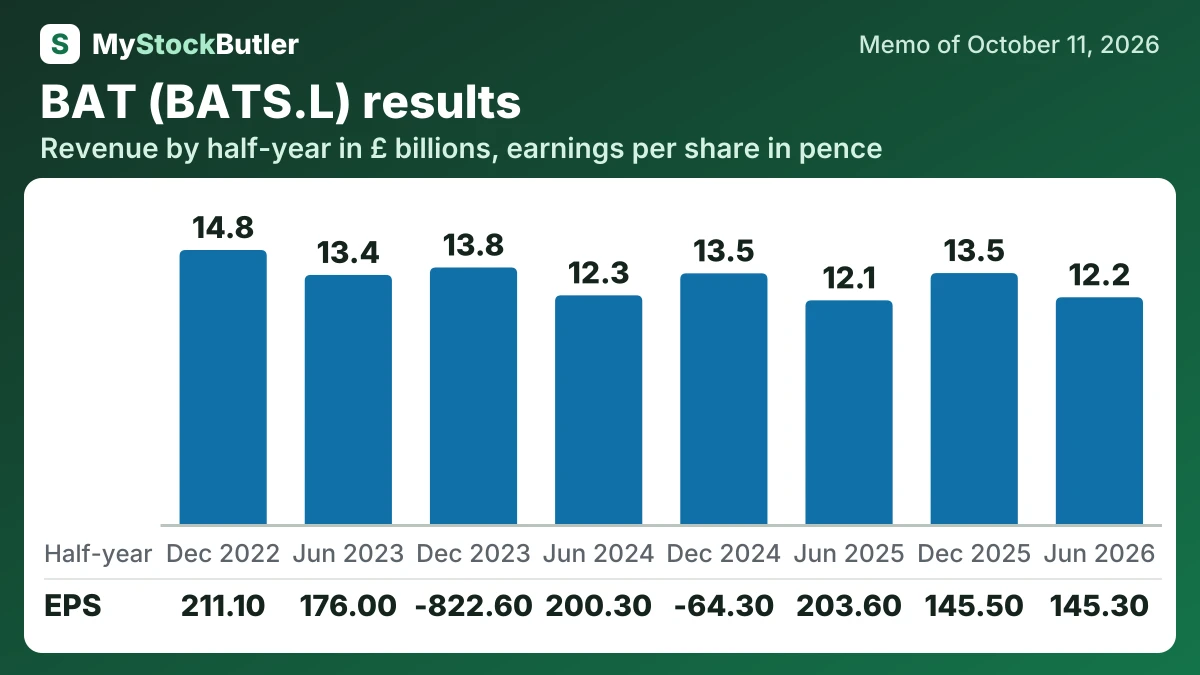
How have BAT revenue and profit changed over the last eight reported periods?
The first half of 2026 brought better product growth and cash generation, but reported profit still fell.
| 6 months to Jun 2026 | 6 months to Dec 2025 | 6 months to Jun 2025 | 6 months to Dec 2024 | 6 months to Jun 2024 | 6 months to Dec 2023 | 6 months to Jun 2023 | 6 months to Dec 2022 | |
|---|---|---|---|---|---|---|---|---|
| Revenue | 12,235 | 13,541 | 12,069 | 13,527 | 12,340 | 13,842 | 13,441 | 14,786 |
| Operating income | 4,266 | 4,928 | 5,069 | -1,522 | 4,258 | -21,686 | 5,935 | 6,845 |
| Net income | 3,190 | 3,252 | 4,512 | -1,424 | 4,492 | -18,326 | 3,959 | 4,807 |
| EPS, diluted | 145.30 | 145.50 | 203.60 | -64.30 | 200.30 | -822.60 | 176.00 | 211.10 |
What should BAT watch in the next release?
The verdict will come from profitable repeat sales, delivered savings and cash conversion. BAT’s first checkpoint is the December 2026 pre-close trading update. Its preliminary results follow on 11 February 2027, when cash conversion and year-end leverage should become clearer. Fit2Win’s 2027 completion and £500m annualised savings milestone will test execution, while the 30.0% New Category contribution-margin target tests Horizon 2030.