Alexandria earnings date
MyStockButler's October 2026 analysis: Alexandria’s next results are expected on January 25, 2027. Watch whether Alexandria’s signed leases become paying tenants before expiring leases create another income gap.
What has Alexandria guided for 2026?
For 2026, management guides to adjusted FFO per share of $6.38–$6.42. It expects $1.1–$2.7 billion from dispositions and partial-interest sales. It plans $1.5–$2.0 billion in construction spending. The plan depends on sales and financing to bridge operating cash and construction needs.
The full-year plan expects adjusted operating cash of $475–$575 million. Dispositions and partial-interest sales are expected to provide $1.1–$2.7 billion. Construction alone requires $1.5–$2.0 billion, so even the highest operating-cash estimate and lowest construction estimate leave $925 million to find before debt reduction.
| Period guided | Low | High | Date given | |
|---|---|---|---|---|
| Funds from operations per share, as adjusted | Year to Dec 2026 | 6.38 | 6.42 | Oct 26, 2026 |
| Net cash provided by operating activities, as adjusted | Year to Dec 2026 | 475 | 575 | Oct 26, 2026 |
| Dispositions and sales of partial interests | Year to Dec 2026 | 1,100 | 2,700 | Oct 26, 2026 |
| Construction | Year to Dec 2026 | 1,500 | 2,000 | Oct 26, 2026 |
Has Alexandria kept its past promises?
Management’s record is reasonably credible: 13 of 15 selected annual ranges were met or exceeded. The important blemish came in 2025, when it lowered all three forecasts. The securities-transfer loss did not explain the miss because adjusted FFO excluded it; weaker leasing and capitalized-interest changes mattered more.
Management maintained its $6.40 full-year adjusted FFO-per-share midpoint on August 4, 2026 and again with the October 26 results, while reporting completion of the Campus Point partial-interest sale in October. Those are identifiable checkpoints, but a forecast is not yet a delivered result.
| What management forecast | Checked | Above | Within | Below |
|---|---|---|---|---|
| Funds from operations per share – diluted, as adjusted | 5 years | 0 | 4 | 1 |
| Same property performance: Net operating income increase | 5 years | 1 | 3 | 1 |
| Same property performance: Net operating income increase (cash basis) | 5 years | 2 | 3 | 0 |
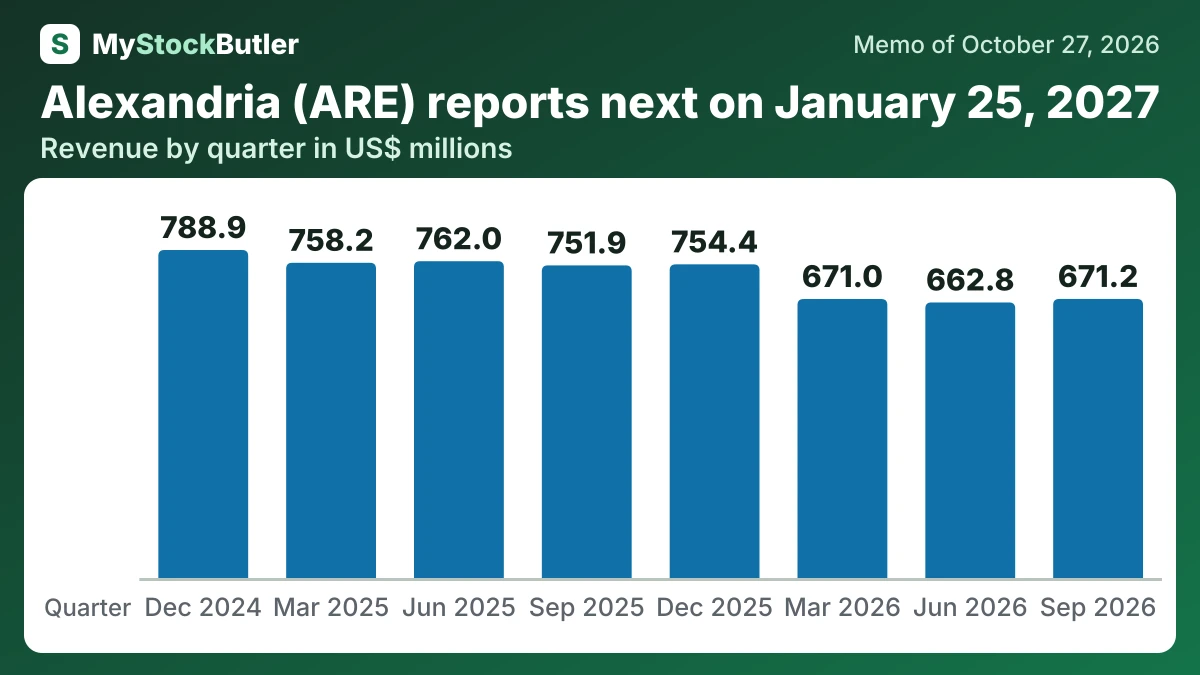
What are Alexandria’s last eight quarters showing?
Revenue was $671.2 million in the September 2026 quarter, down from $751.9 million a year earlier. Cash-basis NOI was $420.6 million, down from $482.0 million. Sequential revenue improved slightly, but NOI weakened, so the top line has not yet produced an operating recovery.
| Sep 2026 | Jun 2026 | Mar 2026 | Dec 2025 | Sep 2025 | Jun 2025 | Mar 2025 | Dec 2024 | |
|---|---|---|---|---|---|---|---|---|
| Revenue | 671,182 | 662,784 | 671,022 | 754,414 | 751,944 | 762,040 | 758,158 | 788,945 |
| Net operating income (cash basis) | 420,560 | 438,682 | 417,998 | 496,281 | 481,978 | 506,474 | 493,152 | 513,700 |
| FFO per share | 1.57 | 2.44 | 3.73 | 1.93 | 2.18 | 1.93 | 1.65 | 1.81 |
What this means. The company's adjusted funds from operations measure does not subtract money spent maintaining its properties, so it may make the cash available for dividends look higher than it really is.