OOIL dividend: history, coverage and yield
MyStockButler's October 2026 analysis: OOIL's dividend record fell from $6.04 in 2022 to $0.84 in 2023, and its latest interim dividend was $0.55. In 2025, free cash flow was negative $678.7 million while dividends paid were $1.35 billion, so the dividend was not covered by that year's free cash flow.
How much does OOIL pay per share?
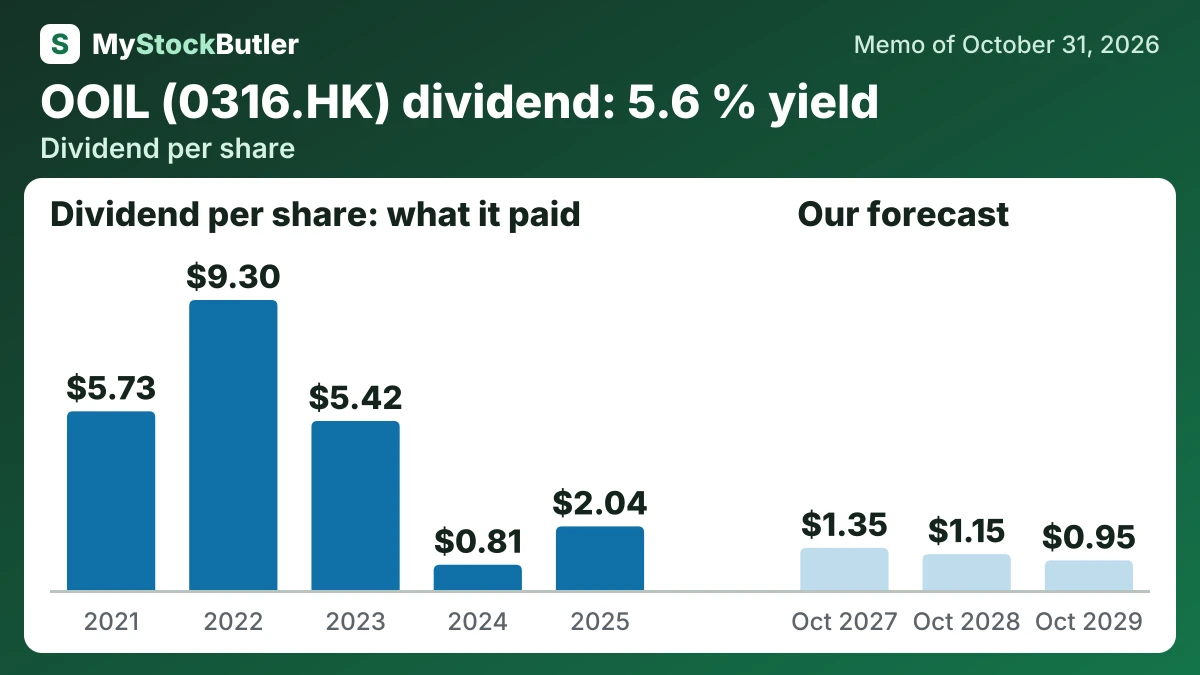
Dividends follow the profit path. The base case uses $1.35, $1.15 and $0.95 per share. The bear case uses $0.65, $0.45 and $0.35. The bull case uses $1.75, $1.65 and $1.45. These paths reflect a dividend record that fell from $6.04 in 2022 to $0.84 in 2023. They also reflect the stated 30%–50% payout target, which remains subject to financial conditions and board discretion. The latest interim dividend was $0.55.
| October 2027 | October 2028 | October 2029 | |
|---|---|---|---|
| Normal operating profit | 2,500 (1,550 / 3,400) | 1,900 (800 / 3,500) | 1,800 (1,100 / 3,000) |
| Dividends per share | 1.35 (0.65 / 1.75) | 1.15 (0.45 / 1.65) | 0.95 (0.35 / 1.45) |
| Net debt | -4,939 (-4,377 / -5,437) | -3,657 (-2,441 / -5,264) | -2,587 (-1,218 / -4,993) |
What this means. The negative net debt means the company has more cash than borrowed money.
Is OOIL's dividend covered by its cash?
The direction changed as ships and containers absorbed more cash. In 2023, free cash flow was negative $1.48 billion while dividends paid were $3.58 billion. In 2025, free cash flow was negative $678.7 million while dividends paid were $1.35 billion. Those payments therefore drew on cash saved earlier and on other cash movements.
Free cash flow deducts investment from operating cash. For a shipping company, lease payments also matter because leased vessels and equipment support the revenue-producing business. In 2025, OOIL spent $2.01 billion on capital expenditure and $656.07 million on lease payments. Real free cash flow was therefore negative $678.7 million after the stock-pay adjustment.
| 2025 | 2024 | 2023 | 2022 | 2021 | |
|---|---|---|---|---|---|
| Free cash flow | -678.697 | 1,289.985 | -1,475.65 | 10,005.581 | 7,854.041 |
| − Dividends paid | 1,347.162 | 535.563 | 3,579.223 | 6,141.471 | 3,682.084 |
| − Share buybacks | 0 | 0 | 0 | 0 | 0 |
| = Free cash flow not paid out | 753.54 | 3,864.11 | 4,171.718 | ||
| Paid out, % of free cash flow | not meaningful | 41.5% | not meaningful | 61.4% | 46.9% |
| Paid out, % of real free cash flow | not meaningful | 41.5% | not meaningful | 61.4% | 46.9% |
What could change OOIL's dividend?
Management targets an annual dividend payout of 30%–50% of profit for 2024–2026. It declared approximately 50% of first-half 2026 profit and recommended approximately 50% for 2025. It has no earnings forecast. Four 13,000-TEU vessels are due in the six months to December 2026.
The bull case would gain support in 2027 and 2028 if the late-2026 revenue recovery persists and utilization remains high. Lower cost per TEU would strengthen it further; OOIL reported a 1% decline in liner operating cost per TEU in 2025. By 2028 and 2029, confirmed cash conversion and profit-linked dividends would determine whether the higher multiple is deserved.
What is OOIL's dividend yield today?
| Today (Oct 31, 2026) | |
|---|---|
| Share price | 158.80 |
| Free cash flow yield (calculated) | -5.1% |
| Dividend yield (calculated) | 5.6% |
What this means. The negative free cash flow yield means the company spent more cash than it generated over the latest year.