OOIL earnings
MyStockButler's October 2026 analysis: In the third quarter of 2026, OOIL's liner revenue rose 45.1% year on year and liftings rose 9.0%, but OOIL has not yet reported the quarter's profit or cash flow. Watch whether the rebound reached margins and cash in the next financial statement.
What has OOIL guided for the year?
Management targets an annual dividend payout of 30%–50% of profit for 2024–2026. It declared approximately 50% of first-half 2026 profit and recommended approximately 50% for 2025. It has no earnings forecast. Four 13,000-TEU vessels are due in the six months to December 2026.
| Period | Low | High | Given on | |
|---|---|---|---|---|
| Target annual dividend payout | 2026 | 30.0% | 50.0% | Mar 21, 2024 |
| New 13,000 TEU class container vessels (vessels) | 6 months to Dec 2026 | 4 | 4 | Aug 27, 2026 |
Has OOIL kept its past promises?
The dividend policy targeted 30%–50% of profit attributable to shareholders for 2024–26, subject to financial conditions and board discretion. OOIL recommended approximately 50% for 2025 and declared approximately 50% for the first half of 2026. That is consistent with the policy, but it is not a guaranteed return: ships, repairs, debt and weaker freight markets may compete with dividends.
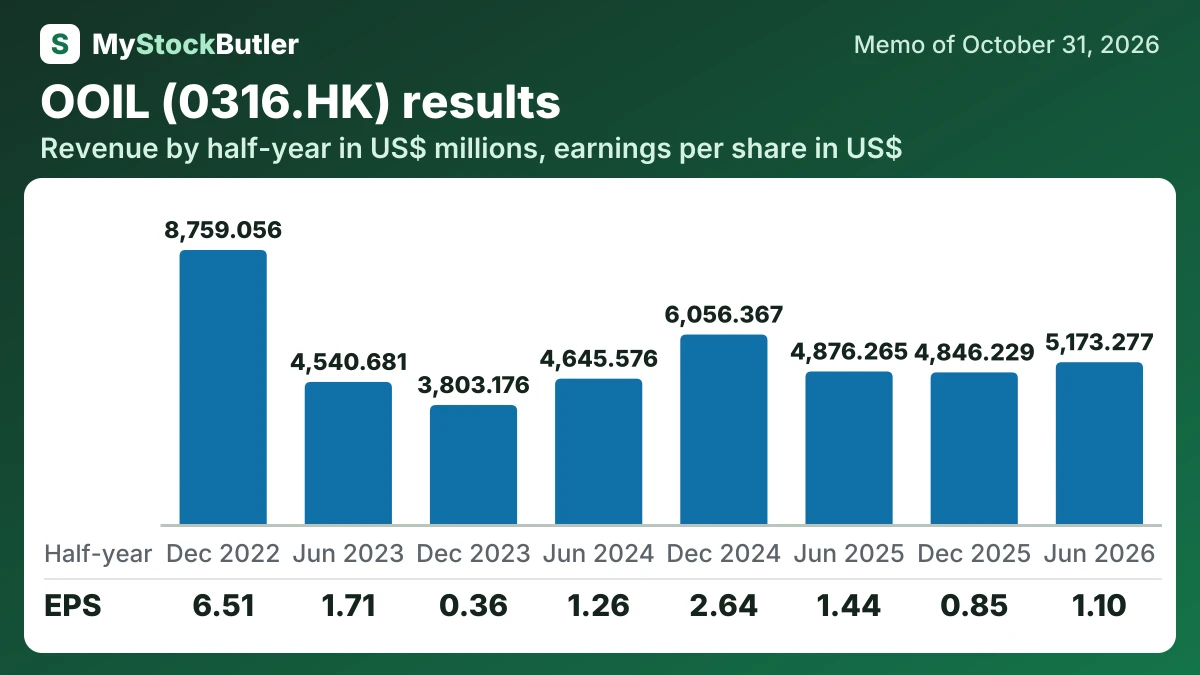
What do OOIL's last eight reported periods show?
In the third quarter of 2026, liner revenue rose 45.1% from a year earlier. Liftings rose 9.0%, so the improvement came mainly from higher revenue per container as well as more cargo. The trans-Pacific trade was especially strong, with revenue up 71.8% and volume up 13.1%.
| 6 months to Jun 2026 | 6 months to Dec 2025 | 6 months to Jun 2025 | 6 months to Dec 2024 | 6 months to Jun 2024 | 6 months to Dec 2023 | 6 months to Jun 2023 | 6 months to Dec 2022 | |
|---|---|---|---|---|---|---|---|---|
| Revenue | 5,173.277 | 4,846.229 | 4,876.265 | 6,056.367 | 4,645.576 | 3,803.176 | 4,540.681 | 8,759.056 |
| Gross margin | 16.2% | 13.7% | 19.9% | 31.5% | 19.7% | 6.6% | 19.9% | 49.1% |
| Operating income | 720.261 | 557.472 | 977.994 | 1,789.929 | 834.915 | 271.377 | 1,134.299 | 4,333.67 |
| Net income | 727.95 | 559.254 | 954.229 | 1,744.169 | 833.277 | 239.119 | 1,128.733 | 4,301.602 |
| EPS, diluted | 1.10 | 0.85 | 1.44 | 2.64 | 1.26 | 0.36 | 1.71 | 6.51 |
What this means. Free cash flow here also subtracts lease payments, even though its definition mentions only equipment spending, so it is cash left after more costs than that definition suggests.
What should I watch in OOIL's next release?
The third-quarter update contains revenue and volume, not fuel, port, handling or vessel costs. Higher rates may therefore improve profit—or those costs may absorb much of the gain. The next financial statement must show whether the rebound reached margins and cash.