OOIL stock forecast 2027–2029
MyStockButler's October 2026 analysis: OOIL's weighted scenario is HKD 247.94 in October 2027. It hinges on rates and utilization as capacity arrives from 2027 to 2029.
Where could OOIL's shares be by 2029?
It then reaches HKD 195.94 in October 2028, a 34% return. By October 2029, it is HKD 169.82, or a 22% return. The final-date range runs from HKD 79.81 to HKD 380.10. The bear case receives 35%, the base case 50%, and the bull case 15%.
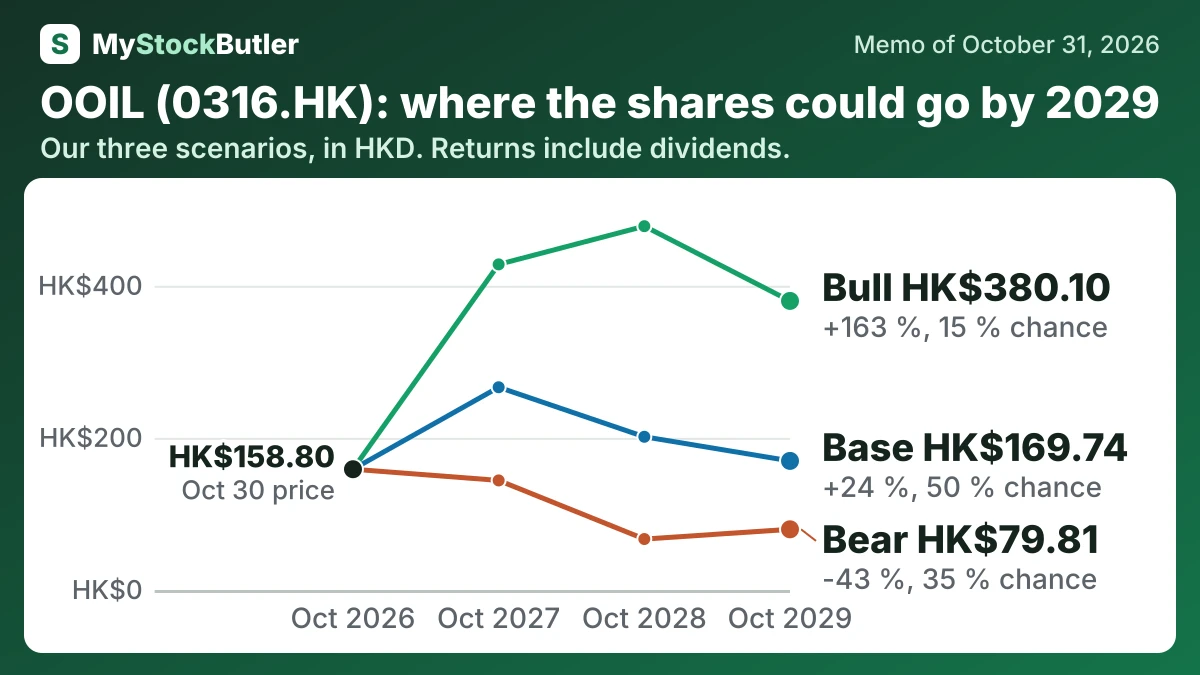
| Case | Probability | October 2027 | October 2028 | October 2029 |
|---|---|---|---|---|
| Bear | 35 % | 144.08 (-6 %) | 67.02 (-52 %) | 79.81 (-43 %) |
| Base | 50 % | 266.59 (+75 %) | 201.46 (+39 %) | 169.74 (+24 %) |
| Bull | 15 % | 428.14 (+178 %) | 478.36 (+218 %) | 380.10 (+163 %) |
| Weighted | 100 % | 247.94 (+62 %) | 195.94 (+34 %) | 169.82 (+22 %) |
What this means. The weighted row is the probability-based average of the bear, base, and bull cases, not a separate forecast.
What has to go right or wrong for OOIL?
The near-term uplift follows Q3 2026 liner revenue rising 45.1% while liftings rose 9.0%, although OOIL did not report quarterly profit. The later moderation reflects capacity risk: capacity grew 16.5% in 2025 while liftings grew 3.7%, and load factor fell from 84% to 82%. The bear case gives $1.55 billion, $0.8 billion and $1.1 billion across the dates. The bull case gives $3.4 billion, $3.5 billion and $3 billion, requiring demand and route disruption to absorb the new ships. OOIL ordered twelve vessels for $2.22 billion, with deliveries due from 2028.
How much cash does OOIL really make?
Free cash flow deducts investment from operating cash. For a shipping company, lease payments also matter because leased vessels and equipment support the revenue-producing business. In 2025, OOIL spent $2.01 billion on capital expenditure and $656.07 million on lease payments. Real free cash flow was therefore negative $678.7 million after the stock-pay adjustment.
| 2025 | 2024 | 2023 | 2022 | 2021 | |
|---|---|---|---|---|---|
| Cash from operations | 1,990.771 | 3,211.515 | 617.196 | 11,253.014 | 8,898.841 |
| − Capital spending | 2,013.399 | 1,261.524 | 1,378.086 | 524.841 | 580.12 |
| − Lease payments | 656.069 | 660.006 | 714.76 | 722.592 | 464.68 |
| = Free cash flow | -678.697 | 1,289.985 | -1,475.65 | 10,005.581 | 7,854.041 |
| − Stock pay | 0 | 0.014 | 0.132 | 1.117 | 2.084 |
| = Real free cash flow | -678.697 | 1,289.971 | -1,475.782 | 10,004.464 | 7,851.957 |
What this means. The business brought in cash from daily operations, but in 2025 and 2023 it spent more on equipment and leases than it brought in, so free cash flow was negative.
What does an investor pay for OOIL today?
P/E compares the share price with earnings per share. A trailing P/E uses the past twelve months; a forward P/E uses an analyst’s estimate. OOIL’s forward figure implies about $2.2 billion of earnings over the next twelve months, compared with $1.51 billion earned in 2025. That is an expectation, not money already earned, and freight rates can change faster than ships can be added or removed.
| Today (Oct 31, 2026) | |
|---|---|
| Share price | 158.80 |
| Market value (calculated) | 104,867.28 |
| Enterprise value (calculated) | 59,279.361 |
| P/E, last 12 months (calculated) | 10.4x |
| P/E, next 12 months (calculated) | 6.1x |
| Free cash flow yield (calculated) | -5.1% |
What this means. The negative free cash flow yield means the company spent more cash than it generated over the latest year.