Suncor vs Cenovus stock: the numbers side by side (October 2026)
How do Suncor and Cenovus compare?
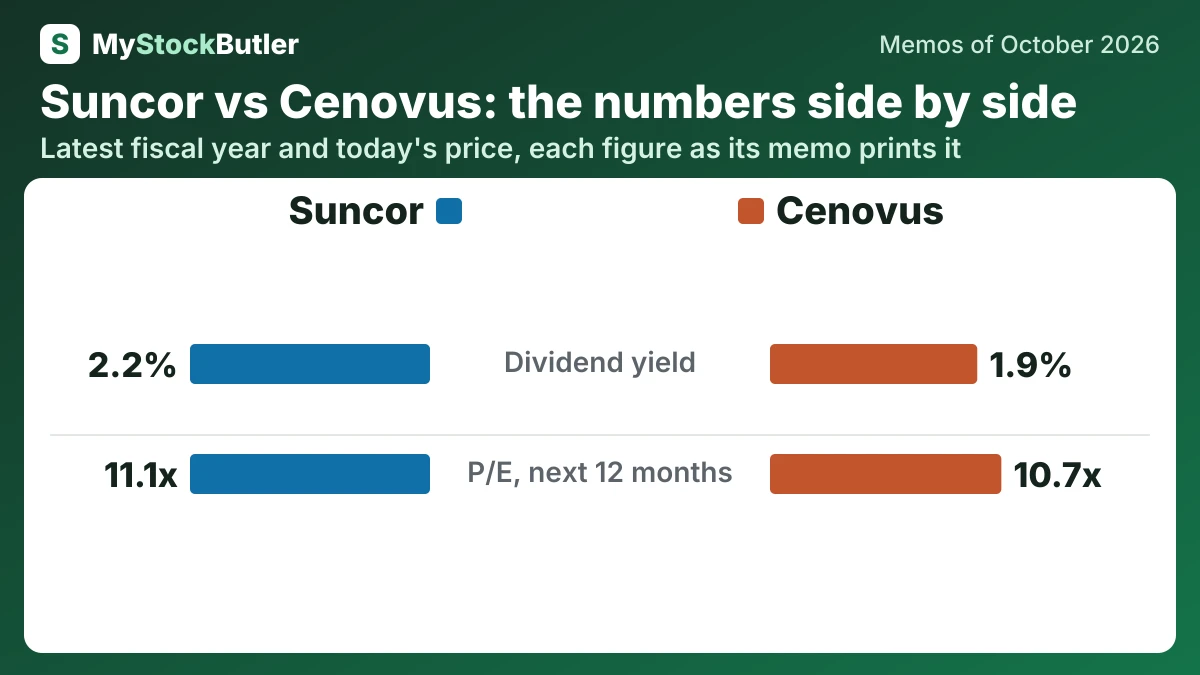
| Suncor SU.TO | Cenovus CVE.TO | |
|---|---|---|
| Dividend yield | 2.2%Today (Oct 23, 2026) | 1.9%Today (Oct 14, 2026) |
| P/E, next 12 months | 11.1xToday (Oct 23, 2026) | 10.7xToday (Oct 14, 2026) |
| Weighted price forecast, about 1 year | 110.01 (+1 %)October 2027 | 45.39 (-1%)October 2027 |
| Weighted price forecast, about 3 years | 158.26 (+49 %)October 2029 | 58.85 (+32%)October 2029 |
Who leads on what?
| Leads | The lead is | |
|---|---|---|
| Dividend yield | Suncor | The higher figure |
| P/E, next 12 months | Cenovus | The lower figure |
| Weighted price forecast, about 1 year | Suncor | The higher weighted return |
| Weighted price forecast, about 3 years | Suncor | The higher weighted return |
What does each company do?
Suncor Energy Inc. extracts oil-sands bitumen, very thick oil that must be processed before it can flow, produces offshore crude, refines crude into fuels, and sells fuel through Petro-Canada and commercial channels.
Suncor (SU.TO), from our memo of October 23, 2026 · Suncor stock forecast
Cenovus Energy produces crude oil, natural gas and NGLs—natural gas liquids such as propane and butane—and sells synthetic crude, fuels and industrial products to refiners, wholesalers, blenders and commercial customers.
Cenovus (CVE.TO), from our memo of October 14, 2026 · Cenovus stock forecast
How big are Suncor and Cenovus?
Suncor reported revenue of C$17,534 million in the quarter to June 2026, and Cenovus reported C$17,427 million in the quarter to June 2026.
How fast are Suncor and Cenovus growing, and what did their latest results show?
Suncor links oil-sands production, upgrading, refining and Petro-Canada sales, so revenue reflects both barrels and prices. Production rose to 860.2 thousand barrels a day in 2025. Revenue was C$49.3 billion, down 3.6%.
Suncor (SU.TO), from our memo of October 23, 2026 · Suncor earnings
The sequential comparison is more revealing. Revenue rose from C$12,356 million in March to C$17,427 million in June. Income rose from C$1,570 million to C$2,870 million, even though production edged down from 972.1 thousand to 970.4 thousand BOE a day. Nearly the same energy-equivalent output produced much more money, so higher prices and refining spreads did most of the work.
Cenovus (CVE.TO), from our memo of October 14, 2026 · Cenovus earnings
How much cash do Suncor and Cenovus generate, and where does it go?
Suncor’s dividend yield was 2.2% on October 23, 2026; Cenovus’ was 1.9% on October 14, 2026.
Cash from operations was C$12.8 billion in 2025. It was C$16.0 billion in 2024, partly because working capital had released cash. Working capital captures the timing of receivables, inventory, payables and accrued liabilities. A delayed supplier payment keeps cash temporarily but creates no extra barrel; 2025 had little net working-capital effect.
Suncor (SU.TO), from our memo of October 23, 2026 · Suncor stock forecast
Operating cash flow was C$5,636 million in June 2026. A C$689 million working-capital release was removed, while C$39 million of cleanup settlements were added back, producing AFF of C$4,986 million. After C$1,200 million of investment, Free Funds Flow was C$3,786 million. Further uses left Excess Free Funds Flow at C$3,257 million.
Cenovus (CVE.TO), from our memo of October 14, 2026 · Cenovus stock forecast
What does an investor pay for Suncor and Cenovus today?
Suncor traded at 11.1x the next 12 months’ earnings on October 23, 2026; Cenovus traded at 10.7x the next 12 months’ earnings on October 14, 2026.
Dividends and enterprise-value-to-funds-flow ratios therefore need to be tested against sustaining capital and weaker oil prices. The central question is how much cash remains after keeping Suncor’s mines, upgraders and refineries productive.
Suncor (SU.TO), from our memo of October 23, 2026 · Suncor dividend
A forward P/E compares the share price with expected earnings over the next year. It is like pricing a bakery by dividing its purchase price by next year’s expected profit, except oil prices, refinery margins and operating costs can quickly change the denominator. Because earnings are accounting profit, an impairment can lower them without an equal current cash payment. Free funds flow is a better cash check, but it is not money automatically available to shareholders: Cenovus reported C$3.964 billion in 2025 after C$4.907 billion of capital investment, and cash still competes with debt repayment, acquisitions and decommissioning.
Cenovus (CVE.TO), from our memo of October 14, 2026 · Cenovus stock forecast