Crédit Agricole S.A. vs Société Générale stock: side by side (October 2026)
How do Crédit Agricole S.A. and Société Générale compare?
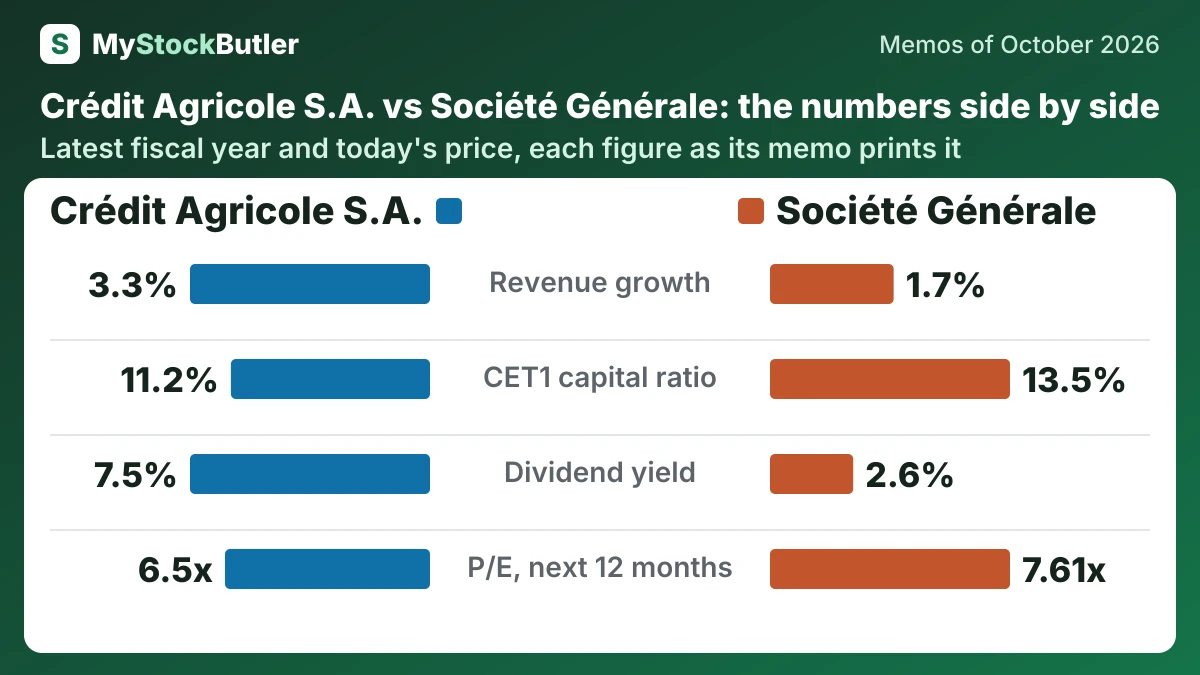
| Crédit Agricole S.A. ACA.PA | Société Générale GLE.PA | |
|---|---|---|
| Revenue growth | 3.3%2025 | 1.7%2025 |
| CET1 capital ratio | 11.2%Sep 2026 | 13.5%2025 |
| Dividend yield | 7.5%Today (Oct 31, 2026) | 2.6%Today (Oct 30, 2026) |
| P/E, last 12 months | 7.2xToday (Oct 31, 2026) | 7.47xToday (Oct 30, 2026) |
| P/E, next 12 months | 6.5xToday (Oct 31, 2026) | 7.61xToday (Oct 30, 2026) |
| Weighted price forecast, about 1 year | 17.09 (+22 %)October 2027 | 59.07 (-0 %)October 2027 |
| Weighted price forecast, about 3 years | 20.43 (+60 %)October 2029 | 80.11 (+41 %)October 2029 |
Who leads on what?
| Leads | The lead is | |
|---|---|---|
| Revenue growth | Crédit Agricole S.A. | The higher figure |
| CET1 capital ratio | Société Générale | The higher figure |
| Dividend yield | Crédit Agricole S.A. | The higher figure |
| P/E, last 12 months | Crédit Agricole S.A. | The lower figure |
| P/E, next 12 months | Crédit Agricole S.A. | The lower figure |
| Weighted price forecast, about 1 year | Crédit Agricole S.A. | The higher weighted return |
| Weighted price forecast, about 3 years | Crédit Agricole S.A. | The higher weighted return |
What does each company do?
Crédit Agricole S.A. is the listed centre of a wider cooperative banking group.
Crédit Agricole S.A. (ACA.PA), from our memo of October 31, 2026 · Crédit Agricole S.A. stock forecast
Société Générale is a French financial group serving households, professionals, companies, investors and public bodies.
Société Générale (GLE.PA), from our memo of October 30, 2026 · Société Générale stock forecast
How big are Crédit Agricole S.A. and Société Générale?
Crédit Agricole S.A. reported revenue of EUR 28,079 million in 2025, and Société Générale reported EUR 27,254 million in 2025.
How fast are Crédit Agricole S.A. and Société Générale growing, and what did their latest results show?
Crédit Agricole S.A.’s revenue grew 3.3% in 2025; Société Générale’s grew 1.7% in 2025.
Bank revenue is called net because the bank keeps the interest it earns from borrowers after paying interest to depositors and other funders, then adds fees, trading income and other operating income. In 2025, net interest income was about €10.1 billion and other income about €17.2 billion, producing revenue of €27.3 billion.
Société Générale (GLE.PA), from our memo of October 30, 2026 · Société Générale stock forecast
How much capital do Crédit Agricole S.A. and Société Générale have, and where does it go?
At Crédit Agricole S.A., the CET1 capital ratio was 11.2% at September 2026; at Société Générale, it was 13.5% at the end of 2025. Crédit Agricole S.A.’s dividend yield was 7.5% on October 31, 2026; Société Générale’s was 2.6% on October 30, 2026.
The bank’s earnings went to several uses: rebuilding capital, buying businesses, funding vehicles and technology, paying common dividends and repurchasing shares. The table distinguishes reported earnings from adjusted earnings, which helps explain distribution decisions without making exceptional losses disappear. It also separates acquisitions from ordinary operating investment.
Société Générale (GLE.PA), from our memo of October 30, 2026 · Société Générale dividend
What does an investor pay for Crédit Agricole S.A. and Société Générale today?
The shares of Crédit Agricole S.A. were priced at 7.2x the last 12 months’ earnings and 6.5x the next 12 months’ on October 31, 2026; those of Société Générale at 7.47x the last 12 months’ earnings and 7.61x the next 12 months’ on October 30, 2026.
The P/E ratio compares the share price with earnings per share. It does not mean handing the company €7.20: if the share price were €14.99 and earnings per share about €2.08, the ratio would be roughly 7.2. The company does not receive that multiple in cash; ordinary trading usually transfers shares between investors. A low P/E can signal value, but it can also signal fear that profits will fall.
Crédit Agricole S.A. (ACA.PA), from our memo of October 31, 2026 · Crédit Agricole S.A. stock forecast
The share price, multiplied by the number of shares, gives the bank’s market value. The price-to-earnings ratio, or P/E, compares the share price with earnings per share: the trailing version uses the last 12 months, while the forward version uses estimated earnings for the next 12 months. The current valuation therefore asks whether today’s profits will last.
Société Générale (GLE.PA), from our memo of October 30, 2026 · Société Générale stock forecast