Société Générale earnings date and guidance
MyStockButler's October 2026 analysis: The next Société Générale results are due on February 4, 2027. Watch whether Société Générale can generate enough durable profit to fund investment, absorb new risks and still distribute excess capital.
What has Société Générale guided for 2026 and 2029?
Management is targeting 13%–14% ROTE in 2029, compared with around 11% for 2026. It expects revenue to grow approximately 3% a year from estimated 2026 to 2029, while bringing the 2029 cost base below €16.3 billion. In the first nine months of 2026, revenue grew 4.1% and the cost-to-income ratio was 58.8%, an encouraging start but not proof of the 2029 outcome.
| Period covered | Target in the bank's words | Date given | |
|---|---|---|---|
| CET1 ratio target | 2026–2029 | Above 13% | 21 Sep 2026 |
| Expected annual revenue growth | 2026 vs. 2025 | More than +2% | 29 Oct 2026 |
| Cost reduction | 2026 vs. 2025 | Around -4% | 30 Jul 2026 |
| Cost-to-income ratio | 2026 | Below 60% | 29 Oct 2026 |
| ROTE | 2026 | Around 11% | 29 Oct 2026 |
| Cost reduction | 2029 vs. 2026 estimated | Approximately -2% | 21 Sep 2026 |
Has Société Générale kept its past promises?
Management’s tested record is strongest on cost of risk, which measures credit-loss charges against lending. Across four classifiable years, the forecast was within the original range in three and below it in one. That supports confidence in this measure, not in every promise the bank has made.
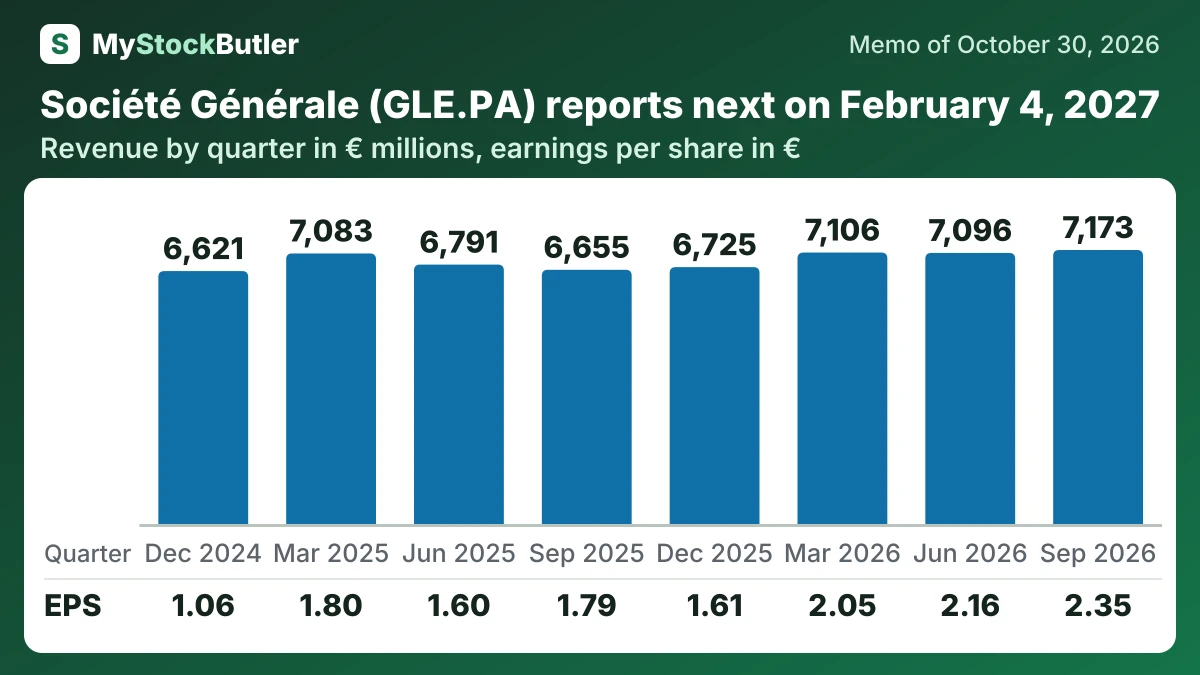
How have Société Générale revenue and profit trended over the last eight reported periods?
Revenue rose 7.8% from Q3 2025, while profit to shareholders rose 24.1%. The result exceeded each of the preceding seven quarters shown, although the CET1 ratio fell to 13.4% from 13.7% a year earlier.
| Sep 2026 | Jun 2026 | Mar 2026 | Dec 2025 | Sep 2025 | Jun 2025 | Mar 2025 | Dec 2024 | |
|---|---|---|---|---|---|---|---|---|
| Revenue | 7,173 | 7,096 | 7,106 | 6,725 | 6,655 | 6,791 | 7,083 | 6,621 |
| Profit to shareholders | 1,888 | 1,790 | 1,696 | 1,420 | 1,521 | 1,453 | 1,608 | 1,041 |
| EPS, diluted | 2.35 | 2.16 | 2.05 | 1.61 | 1.79 | 1.60 | 1.80 | 1.06 |
| CET1 capital ratio | 13.4% | 13.2% | 13.5% | 13.5% | 13.7% | 13.5% | 13.4% | 13.3% |
What this means. The June 2026 and June 2025 safety ratios include share buybacks announced after those periods ended, so they are not based only on what was known then.
What should Société Générale watchers look for next?
The central question is therefore simple: can Société Générale generate enough durable profit to fund investment, absorb new risks and still distribute excess capital? The answer will emerge from the gap between its targets and the capital left after reality tests them.