Crédit Agricole S.A. stock forecast 2027–2029
MyStockButler's October 2026 analysis: Crédit Agricole S.A.'s weighted price reaches €20.43 in October 2029, across bear, base and bull scenarios with probabilities of 27%, 53% and 20%. The path hinges on credit losses, deposit pricing, used-car values and IKB integration.
Where could Crédit Agricole S.A.'s shares be by October 2029?
The weighted price reaches €17.09 in October 2027. Including dividends, that is a return of 22% from today’s €14.99. It rises to €18.62 in October 2028, or 39% with dividends. By October 2029, the weighted price reaches €20.43, implying a 60% total return.
At the final date, the bear case gives €12.08 while the bull case gives €30.27. The bear probability is 27%. The base probability is 53%. The bull probability is 20%. Those odds reflect a stable capital base and dividend record, but unresolved credit, mobility and integration risks.
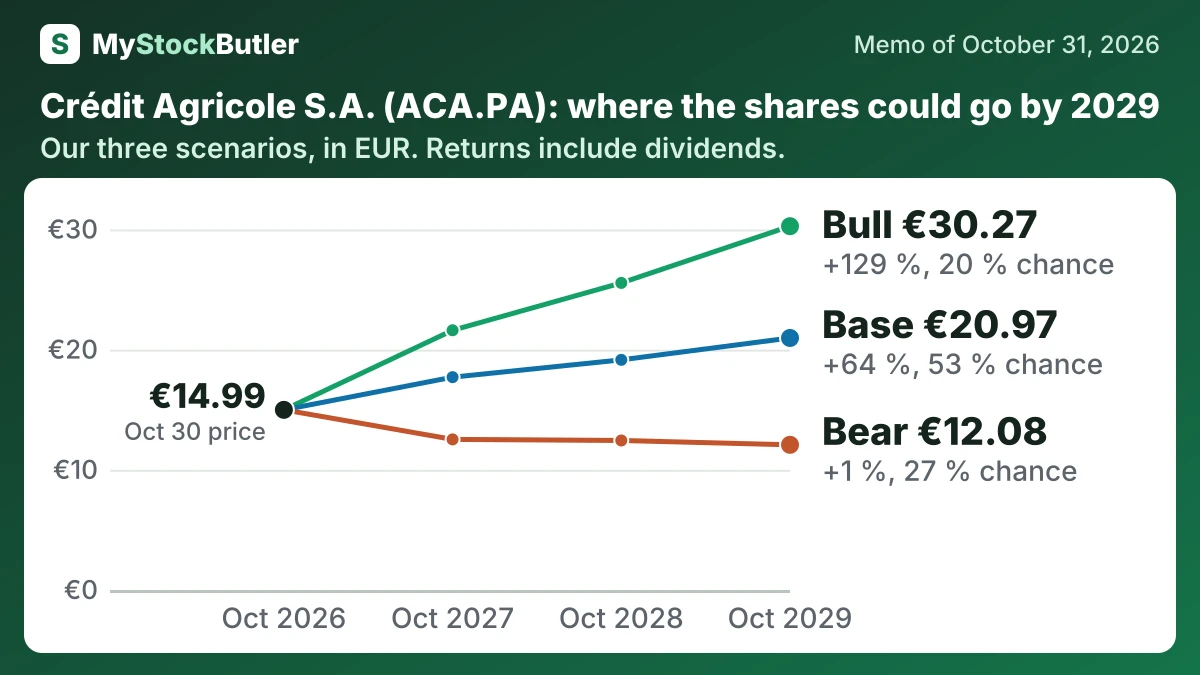
| Case | Probability | October 2027 | October 2028 | October 2029 |
|---|---|---|---|---|
| Bear | 27 % | 12.53 (-10 %) | 12.44 (-4 %) | 12.08 (+1 %) |
| Base | 53 % | 17.71 (+26 %) | 19.15 (+43 %) | 20.97 (+64 %) |
| Bull | 20 % | 21.61 (+52 %) | 25.55 (+87 %) | 30.27 (+129 %) |
| Weighted | 100 % | 17.09 (+22 %) | 18.62 (+39 %) | 20.43 (+60 %) |
What this means. The weighted row is a probability-based average of the bear, base, and bull cases, not a guaranteed share price.
What has to go right or wrong for Crédit Agricole S.A.?
Book value is the foundation of every path. The base case rises from €72,907m to €76,557m in October 2027 and €80,457m in October 2028. It reaches €84,607m in October 2029. The forecast assumes earnings of €7,300m in the first period and €8,300m in the third. The bear case uses €5,500m initially and €5,000m in the middle period, while the bull case reaches €9,500m in the third period.
| October 2027 | October 2028 | October 2029 | |
|---|---|---|---|
| Book value | 76,557 (76,207 / 76,807) | 80,457 (79,207 / 81,157) | 84,607 (82,507 / 86,907) |
| Shares (millions) | 3,025 (3,041 / 3,021) | 3,026 (3,057 / 3,018) | 3,026 (3,073 / 3,014) |
| Dividends per share | 1.15 (1.00 / 1.20) | 1.20 (1.00 / 1.35) | 1.25 (1.05 / 1.50) |
| Price to book value | 0.70 (0.50 / 0.85) | 0.72 (0.48 / 0.95) | 0.75 (0.45 / 1.05) |
What this means. A price to book value of 0.70 means investors are paying 70 cents for each euro of the company's net assets.
How much cash does Crédit Agricole S.A. really make and give back?
Retained profit can increase CET1, while new lending increases risk-weighted assets. Acquisitions, losses, coupons and dividends use the available headroom. The dividend rose for 2025, but its sustainability depends on capital generated after these competing demands.
| 2025 | 2024 | 2023 | 2022 | 2021 | |
|---|---|---|---|---|---|
| Revenue | 28,079 | 27,181 | 25,180 | 22,491 | |
| Profit to shareholders | 7,074 | 7,087 | 6,351 | 5,185 | |
| EPS, diluted | 2.18 | 2.11 | 1.94 | 1.60 | |
| Dividend per share | 1.13 | 1.10 | 1.05 | 1.05 | 1.05 |
What this means. The 2021 and 2022 dividends per share include an extra 0.20 euros to make up for an unpaid 2019 dividend, so they were unusually high.
What does an investor pay for Crédit Agricole S.A. today?
The P/E ratio compares the share price with earnings per share. It does not mean handing the company €7.20: if the share price were €14.99 and earnings per share about €2.08, the ratio would be roughly 7.2. The company does not receive that multiple in cash; ordinary trading usually transfers shares between investors. A low P/E can signal value, but it can also signal fear that profits will fall.