Weir stock forecast 2027–2029
MyStockButler's October 2026 analysis: Weir's weighted price is 2,897.92p by October 2027. The forecast hinges on turning Weir's installed base and software growth into cash while reducing debt.
Where could Weir's shares be by October 2029?
The forecast puts the weighted price at 2,897.92p by October 2027, a 13% return. It reaches 3,684.36p by October 2029, a 47% return. The bear case has 25% probability and the base case 55%. The bull case has 20%.
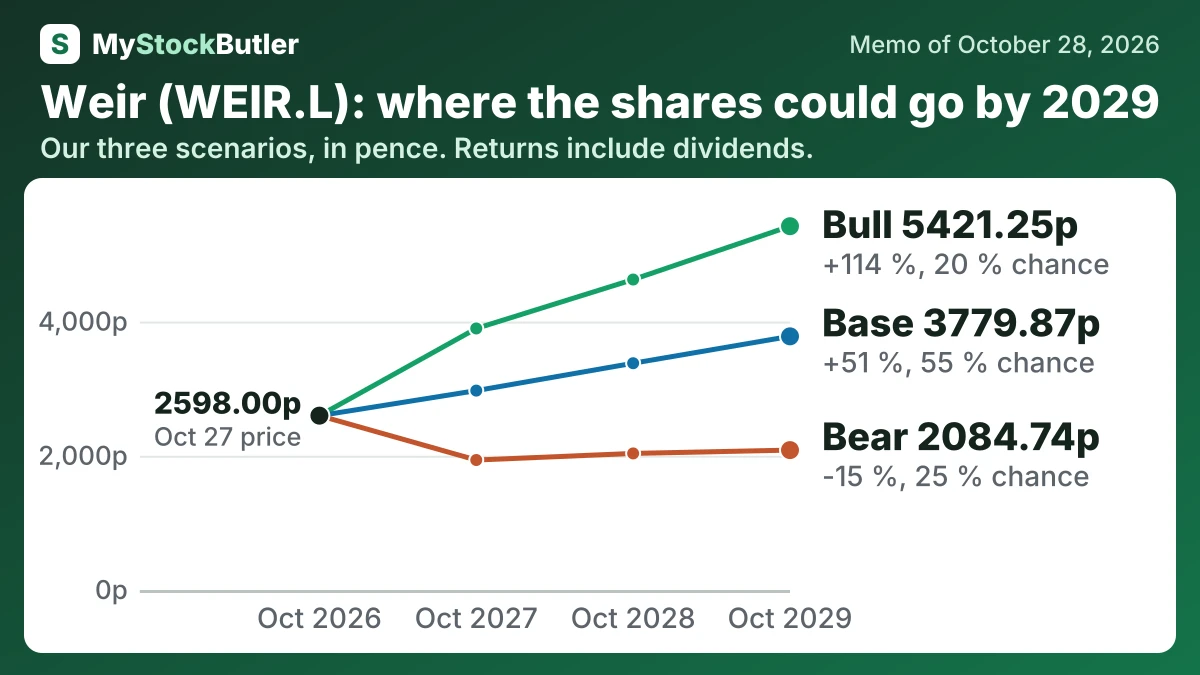
| Case | Probability | October 2027 | October 2028 | October 2029 |
|---|---|---|---|---|
| Bear | 25 % | 1936.81 (-24 %) | 2035.26 (-19 %) | 2084.74 (-15 %) |
| Base | 55 % | 2971.36 (+16 %) | 3379.27 (+34 %) | 3779.87 (+51 %) |
| Bull | 20 % | 3897.35 (+52 %) | 4626.45 (+82 %) | 5421.25 (+114 %) |
| Weighted | 100 % | 2897.92 (+13 %) | 3292.71 (+30 %) | 3684.36 (+47 %) |
What this means. The weighted row is the probability-based average of the bear, base, and bull cases, not a guaranteed share price.
What has to go right for Weir's stock forecast, and what could go wrong?
The base assumes 5% annual organic growth. Margins are 20.3% in the first window and 20.5% thereafter. Bear assumes roughly flat revenue and an 18.2% first-period margin because transfers and weak demand persist. Bull assumes 7% growth. Its margins rise from 21.0% to 21.5%. Adjusted operating income already rose from £296.2m in 2021 to £517.6m in 2025, but the latest half also showed £239m of adjusted profit and 41% cash conversion, so straight-line growth would ignore execution risk.
| October 2027 | October 2028 | October 2029 | |
|---|---|---|---|
| Normal operating profit | 579 (500 / 611) | 614 (535 / 663) | 644 (560 / 716) |
| Shares (millions) | 260 (260 / 259) | 260 (260 / 259) | 260 (261 / 259) |
| Dividends per share | 0.44 (0.42 / 0.46) | 0.46 (0.40 / 0.50) | 0.48 (0.40 / 0.54) |
| Enterprise value to normal operating profit | 15.00 (12.50 / 18.00) | 15.50 (12.00 / 19.00) | 16.00 (11.50 / 20.00) |
| Net debt | 971 (1,216 / 893) | 744 (1,124 / 617) | 491 (1,009 / 300) |
How much cash does Weir really make?
Revenue was £2,564.5m in 2025, still below 2023. Weir’s real free cash flow was 8.3% of revenue in 2025, down from 11.4% in 2024. Net debt rose to £1,117.6m in 2025 from £407.6m in 2024. EPS fell to 95.00p, while real free cash flow per share was 81.79p. Weir made no share buybacks in 2025.
| 2025 | 2024 | 2023 | 2022 | 2021 | |
|---|---|---|---|---|---|
| Cash from operations | 385.4 | 449.9 | 394.3 | 320.8 | 172.4 |
| = Free cash flow | 224.1 | 295.8 | 229.2 | 184.3 | |
| − Stock pay | 11.7 | 10.4 | 7.0 | 8.0 | 10.9 |
| = Real free cash flow | 212.4 | 285.4 | 222.2 | 176.3 | |
| Real free cash flow, % of revenue | 8.3% | 11.4% | 8.4% | 7.1% |
What this means. The company's free cash flow is higher because it leaves out £43.0 million of cash costs that our count includes.
What does Weir stock cost today?
Cash flow is the final check. Inventory, customer credit, equipment, interest and tax can consume cash after accounting profit appears. Weir’s first-half 2026 free cash flow after interest and tax was only £1 million, so its dividend and cash yield must be judged against what remains after running and financing the business.