Vodafone earnings: guidance and results
MyStockButler's October 2026 analysis: Q1 FY27 brought organic service-revenue growth of 5.2% and organic adjusted EBITDAaL growth of 6.2%. The next release should show whether higher ARPU is accompanied by improving retention.
What has Vodafone guided for FY27?
For FY27, management guides to Group adjusted EBITDAaL of €13.0–€13.3 billion and adjusted free cash flow of €2.6–€2.9 billion. Europe’s adjusted EBITDAaL range is €7.6–€7.9 billion. Stronger UK earnings, helped by merger savings, are expected to offset declining German earnings.
The plan carries a substantial bill. Restructuring and integration costs are expected to reach €0.7 billion in FY27, including €0.4 billion for VodafoneThree. Management’s leverage range is 2.25–2.75 times net debt to adjusted EBITDAaL, with a target to finish the year in the lower half. The interim dividend is 50.0% of the previous full-year dividend, which is a payment rule rather than a promise to distribute half of current earnings.
| Period | Low | High | Given on | |
|---|---|---|---|---|
| Adjusted EBITDAaL (Group) | Year to Mar 2027 | 13.0 | 13.3 | 27 Jul 2026 |
| Adjusted EBITDAaL (Europe) | Year to Mar 2027 | 7.6 | 7.9 | 27 Jul 2026 |
| Adjusted free cash flow (Group) | Year to Mar 2027 | 2.6 | 2.9 | 27 Jul 2026 |
| Restructuring and integration costs | Year to Mar 2027 | 0.7 | 0.7 | 27 Jul 2026 |
| Group leverage (net debt / Adjusted EBITDAaL, x) | Year to Mar 2027 | 2.25x | 2.75x | 8 Oct 2026 |
What this means. VodafoneThree integration costs are already included in the total restructuring and integration costs, so do not add both figures together.
Has Vodafone kept its past promises?
Vodafone can point to 11,000 role reductions against a target of 10,000, and reported service-revenue growth across all segments in its July update. Germany’s declining broadband base shows why completing a restructuring is not the same as proving durable improvement. The final judgement is whether management, the board and Vega turn those promises into stronger customers, cash flow and long-term shareholder value.
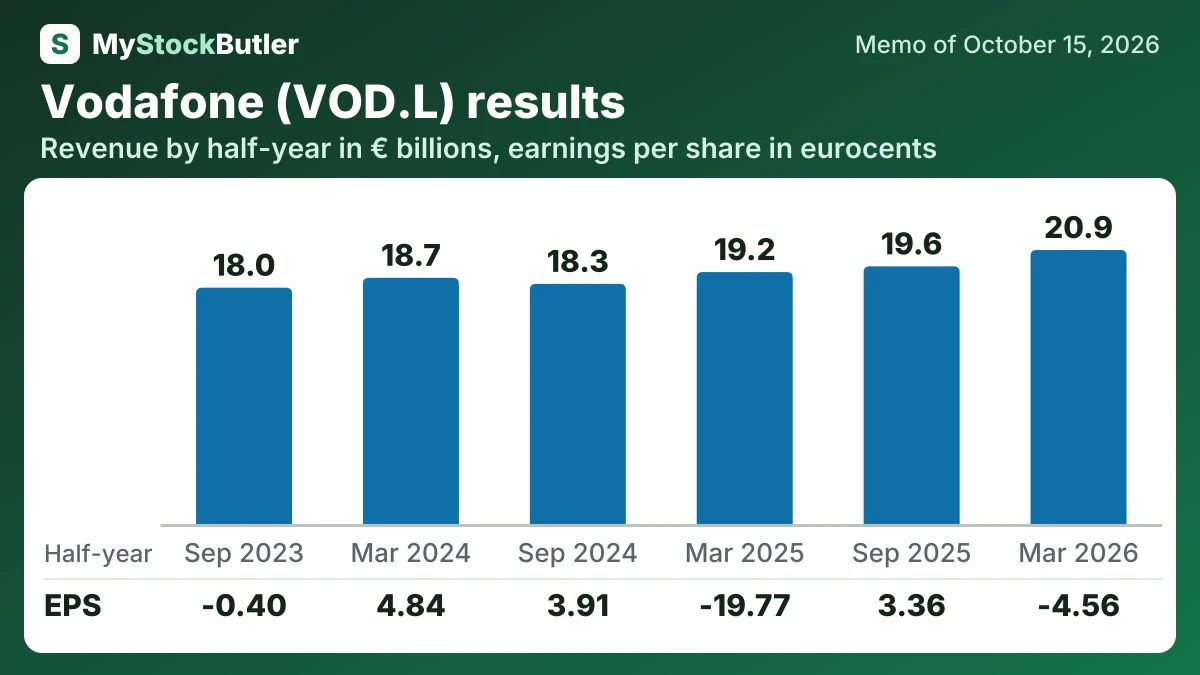
What is Vodafone's trend across the last eight reported periods?
| 6 months to Mar 2026 | 6 months to Sep 2025 | 6 months to Mar 2025 | 6 months to Sep 2024 | 6 months to Mar 2024 | 6 months to Sep 2023 | |
|---|---|---|---|---|---|---|
| Revenue | 20,852 | 19,609 | 19,172 | 18,276 | 18,734 | 17,983 |
| Gross margin | 30.5% | 32.5% | 33.2% | 33.7% | 33.6% | 33.2% |
| Operating income | 682 | 2,162 | -2,793 | 2,382 | 1,808 | 1,857 |
| Net income | -1,118 | 829 | -5,195 | 1,048 | 1,312 | -107 |
| EPS, diluted | -4.56 | 3.36 | -19.77 | 3.91 | 4.84 | -0.40 |
What this means. Free cash flow here also subtracts lease payments and interest, so it is the cash left after more bills than the definition mentions.
What should people watch in Vodafone's next release?
Q1 FY27, covering April to June 2026, brought organic service-revenue growth of 5.2% and organic adjusted EBITDAaL growth of 6.2%. Costs were therefore rising more slowly than sales, which suggests some operating leverage.
Through March 2027, ARPU and churn should tell a consistent operating story. ARPU means average revenue per user; churn means customers leaving. Higher ARPU helps fund the network, but not if customers depart faster. Vodafone should show improving retention alongside coverage and capacity, rather than relying only on discounts.