VICI stock forecast 2027–2029
MyStockButler's October 2026 analysis: VICI’s probability-weighted price reaches $27.74 in October 2029, with 55% probability on the base case. It hinges on Caesars stabilizing and rent collections holding up.
Where could VICI’s shares be by 2029?
The probability-weighted price is $24.76 in October 2027, implying a 13% total return including dividends. It reaches $26.13 in October 2028, a 27% return. By October 2029, it reaches $27.74, a 42% return.
The final-date range runs from $16.31 in the bear case to $38.01 in the bull case, against today’s $23.52. The bear case has 27% probability. The base case has 55%, while the bull case has 18%.
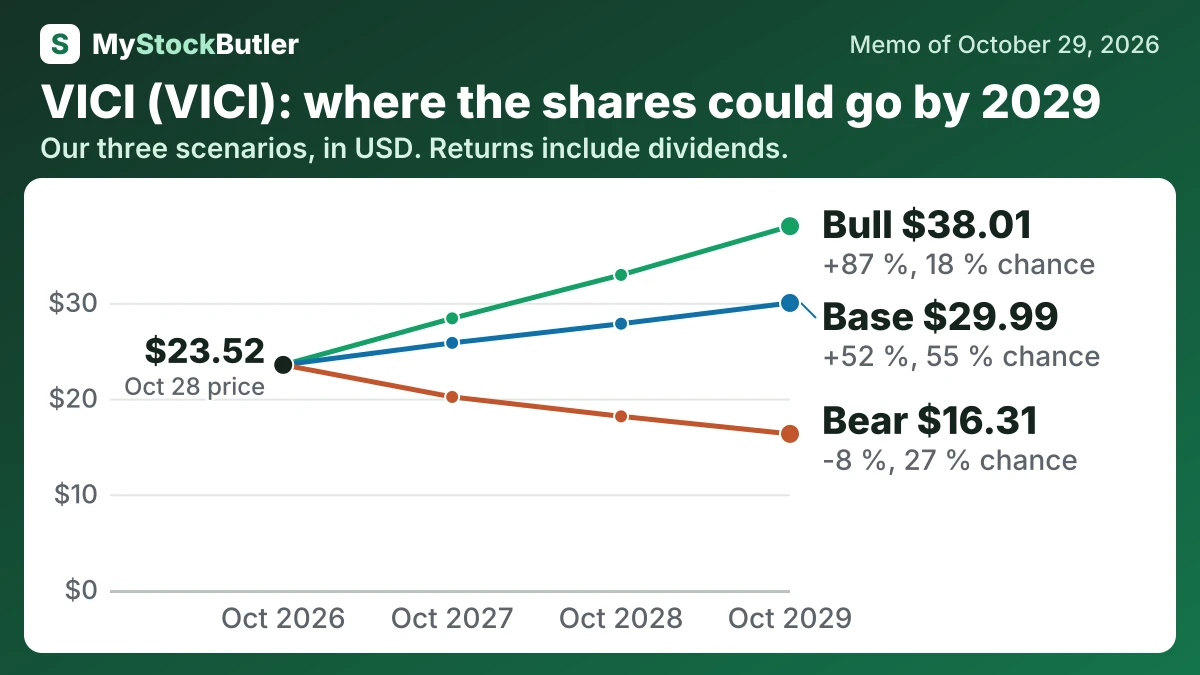
| Case | Probability | October 2027 | October 2028 | October 2029 |
|---|---|---|---|---|
| Bear | 27 % | 20.17 (-6 %) | 18.14 (-7 %) | 16.31 (-8 %) |
| Base | 55 % | 25.82 (+18 %) | 27.82 (+34 %) | 29.99 (+52 %) |
| Bull | 18 % | 28.38 (+29 %) | 32.92 (+57 %) | 38.01 (+87 %) |
| Weighted | 100 % | 24.76 (+13 %) | 26.13 (+27 %) | 27.74 (+42 %) |
What this means. The weighted row is a probability-based average of the bear, base, and bull cases, not a guaranteed share price.
What has to go right or wrong for VICI?
In the bear story, Caesars’ weaker credit becomes a cash-flow problem, refinancing costs rise and loan or development outcomes disappoint. The price falls to $20.17 in October 2027 and $16.31 by October 2029. Its 27% probability reflects serious concentration risk, but rent remained current and the allowance was not itself a realized cash loss.
How much cash does VICI really make?
FFO begins with net income and removes selected real-estate effects. AFFO then adjusts for items such as non-cash lease income, credit-loss estimates, acquisition costs, stock compensation and golf-course spending. These adjustments clarify recurring operations, but management chooses them and companies do not calculate AFFO identically.
| 2025 | 2024 | 2023 | 2022 | 2021 | |
|---|---|---|---|---|---|
| AFFO (company's measure) | 2,526,256 | 2,370,793 | 2,187,040 | 1,693,801 | 1,047,437 |
| AFFO per share (company's measure) | 2.38 | 2.26 | 2.15 | 1.93 | 1.82 |
| Dividends paid | 1,853,467 | 1,752,991 | 1,583,840 | 1,219,117 | 758,790 |
| AFFO payout ratio | 74.2% | 75.0% | 74.9% | 77.7% | 75.8% |
What this means. The payout ratio is our calculation of dividends per share divided by adjusted funds from operations per share, not a percentage the company reports itself.
What does an investor pay for VICI today?
At today’s price, investors pay 10.8 times FFO and 9.6 times AFFO. FFO adjusts accounting profit for much of real-estate depreciation, while AFFO makes further adjustments for items such as non-cash lease accounting and estimated credit losses. In Q3 2026, net income was $0.31 per share, down from $0.71 a year earlier. AFFO was $0.62, up from $0.60. The adjustment was not rent missed that quarter, but it still reflects tenant credit risk. P/E, which divides price by accounting earnings, is therefore noisy here.
| Today (Oct 29, 2026) | |
|---|---|
| Share price | 23.52 |
| Market value (calculated) | 25,897.532936 |
| Price to FFO (calculated) | 10.8x |
| Price to AFFO (calculated) | 9.6x |
| Dividend yield (calculated) | 7.8% |