Steel Dynamics stock forecast 2027–2029
MyStockButler's October 2026 analysis: The weighted price is $285.13 in October 2029, a 19% gain. It hinges on normalized steel earnings, a successful aluminum ramp and better cash conversion.
Where could Steel Dynamics shares be by 2029?
The weighted price is $221.11 in October 2027, a 9% loss including dividends. It is $285.13 in October 2029, a 19% gain. The bear case has 25% probability; the base case has 55%. The bull case has 20%.
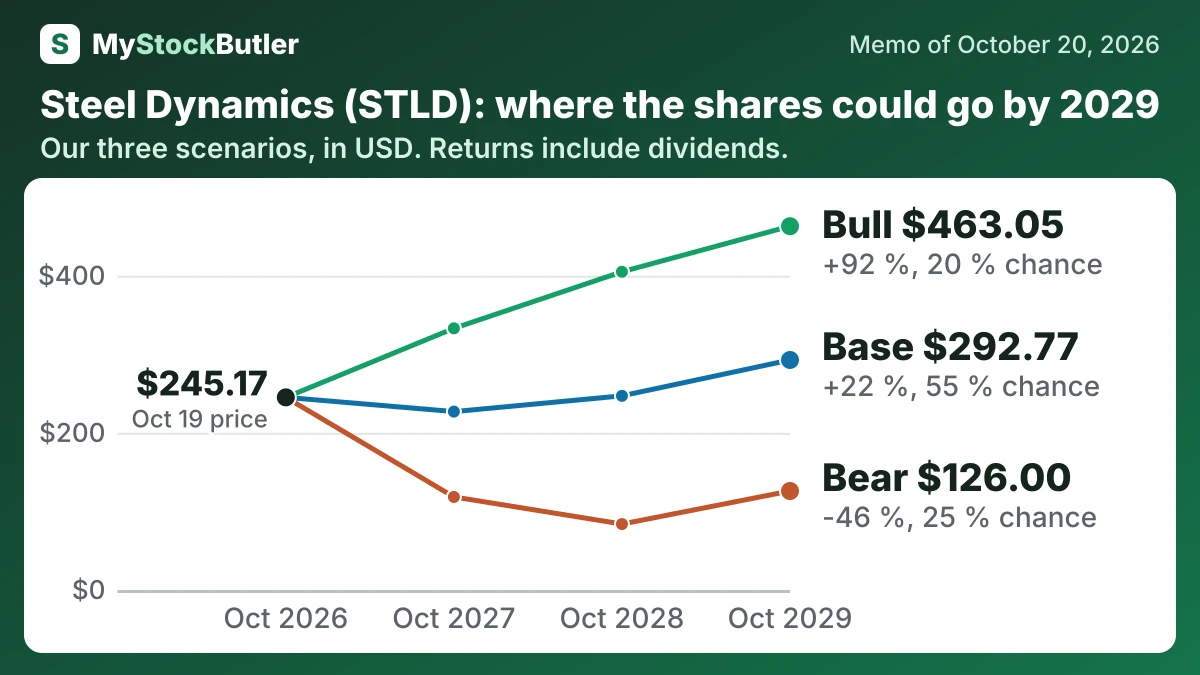
| Case | Probability | October 2027 | October 2028 | October 2029 |
|---|---|---|---|---|
| Bear | 25 % | 118.45 (-51 %) | 83.94 (-64 %) | 126.00 (-46 %) |
| Base | 55 % | 227.06 (-6 %) | 247.14 (+3 %) | 292.77 (+22 %) |
| Bull | 20 % | 333.06 (+37 %) | 405.05 (+67 %) | 463.05 (+92 %) |
| Weighted | 100 % | 221.11 (-9 %) | 237.92 (-1 %) | 285.13 (+19 %) |
What has to go right or wrong for Steel Dynamics?
The decision turns on steel spreads, external shipments and utilization, then on aluminum’s accepted shipments, yield, qualifications and startup costs. The dated tests are automotive shipments before the end of 2026 and the second heat-treatment line early in the first quarter of 2027. The investment bill and 2027 budget must fit cash generation and preparation for 2027–28 debt maturities.
| October 2027 | October 2028 | October 2029 | |
|---|---|---|---|
| EBITDA | 4,000 (2,800 / 4,800) | 4,100 (2,200 / 5,200) | 4,300 (2,700 / 5,500) |
| Shares (millions) | 140 (141 / 138) | 137 (139 / 135) | 135 (136 / 132) |
| Dividends per share | 2.24 (2.12 / 2.24) | 2.36 (1.60 / 2.48) | 2.48 (1.60 / 2.72) |
| Enterprise value to ebitda | 8.50 (7.00 / 10.00) | 8.50 (6.50 / 10.50) | 9.00 (7.00 / 11.00) |
| Net debt | 2,303 (2,934 / 1,871) | 992 (2,657 / -122) | -707 (1,701 / -715) |
How much cash does Steel Dynamics really make?
SDI’s own free-cash-flow measure starts with adjusted EBITDA, not operating cash. It describes operating capacity before taxes, interest, inventory purchases and unpaid invoices. Conventional free cash flow asks the simpler question: what remained after actual operating cash and capital spending?
Stock compensation is another owner cost. Employees paid in shares do not receive cash from SDI, but existing owners bear dilution. Deducting that cost gives a stricter analytical measure of free cash flow.
| 2025 | 2024 | 2023 | 2022 | 2021 | |
|---|---|---|---|---|---|
| Cash from operations | 1,449,534 | 1,844,503 | 3,519,928 | 4,460,403 | 2,204,136 |
| − Capital spending | 948,025 | 1,868,006 | 1,657,905 | 908,902 | 1,006,239 |
| = Free cash flow | 501,509 | -23,503 | 1,862,023 | 3,551,501 | 1,197,897 |
| − Stock pay | 68,983 | 66,589 | 61,744 | 59,240 | 57,715 |
| = Real free cash flow | 432,526 | -90,092 | 1,800,279 | 3,492,261 | 1,140,182 |
What this means. The company's own free cash flow is higher because it leaves out cash tied up in working capital and other cash costs, while we count the cash that actually left the business.
What does an investor pay for Steel Dynamics today?
The trailing P/E, or price-to-earnings ratio, was 18.1x and the forward P/E was 13.8x. A forward P/E is lower when investors expect future profit to rise. At $245.17, the forward multiple implies about $17.77 of earnings per share, an estimate rather than cash already earned. It implies roughly 31% growth from the earnings behind the trailing multiple.