Stella-Jones earnings date
MyStockButler's October 2026 analysis: Stella-Jones’s next results are expected on November 4, 2026. Watch whether Stella-Jones turns price recovery and lower temporary costs into better profitability.
What has Stella-Jones guided for the year?
The verdict is positive but conditional: the weighted case reaches C$96.80 by October 2029 if demand normalizes, margins recover, capacity fills and cash converts. Management targets 4.0%–5.0% annual sales growth and a 17.5%–18.5% adjusted EBITDA margin for 2026–2028, while guiding that 2026 will be below 17.5%. It targets at least 10.0% annual adjusted basic EPS growth and C$225 million of Locweld and Brooks revenue by 2028. Maintenance capital is C$85–95 million annually, with net debt to adjusted EBITDA at 2.0x–2.5x.
The longer plan also calls for steady sales growth, faster growth in adjusted basic earnings per share and new U.S. steel capacity. Earnings per share can rise through better operations or share repurchases, which spread earnings across fewer shares. The steel expansion therefore adds a physical test to the financial promise.
| Period guided | Low | High | Date given | |
|---|---|---|---|---|
| Adjusted EBITDA margin | 2026 | 17.5% | August 6, 2026 | |
| Sales (CAGR) | 2026-2028 | 4.0% | 5.0% | August 6, 2026 |
| Adjusted EPS - basic (CAGR) | 2026-2028 | 10.0% | August 6, 2026 | |
| Maintenance Capital Expenditures | 2026-2028 | 85 | 95 | November 20, 2025 |
| Net debt-to-adjusted EBITDA | 2026-2028 | 2.0x | 2.5x | August 6, 2026 |
| EBITDA-to-free cash flow conversion | 2026-2028 | 50.0% | 50.0% | November 20, 2025 |
Has Stella-Jones kept its past promises?
The record on promises is more mixed. On August 6, 2025, management lowered its sales objective. It moved from approximately C$3.6 billion to C$3.5 billion, including Locweld. Slower utility-pole growth and a railway customer’s decision to treat ties internally contributed to the change. Actual 2025 sales were C$3.492 billion, so management met the revised objective, not the original one.
| What management forecast | Checked | Above | Within | Below |
|---|---|---|---|---|
| EBITDA margin | 4 years | 3 | 0 | 1 |
| Railway Ties — annual organic sales growth | 4 years | 3 | 0 | 1 |
| Net Debt-to-EBITDA | 5 years | 2 | 3 | 0 |
What this means. The three out of five score is a separate summary, not the number of forecasts met in the rows below, which cover different numbers of years.
What has Stella-Jones’s revenue and profit trend been?
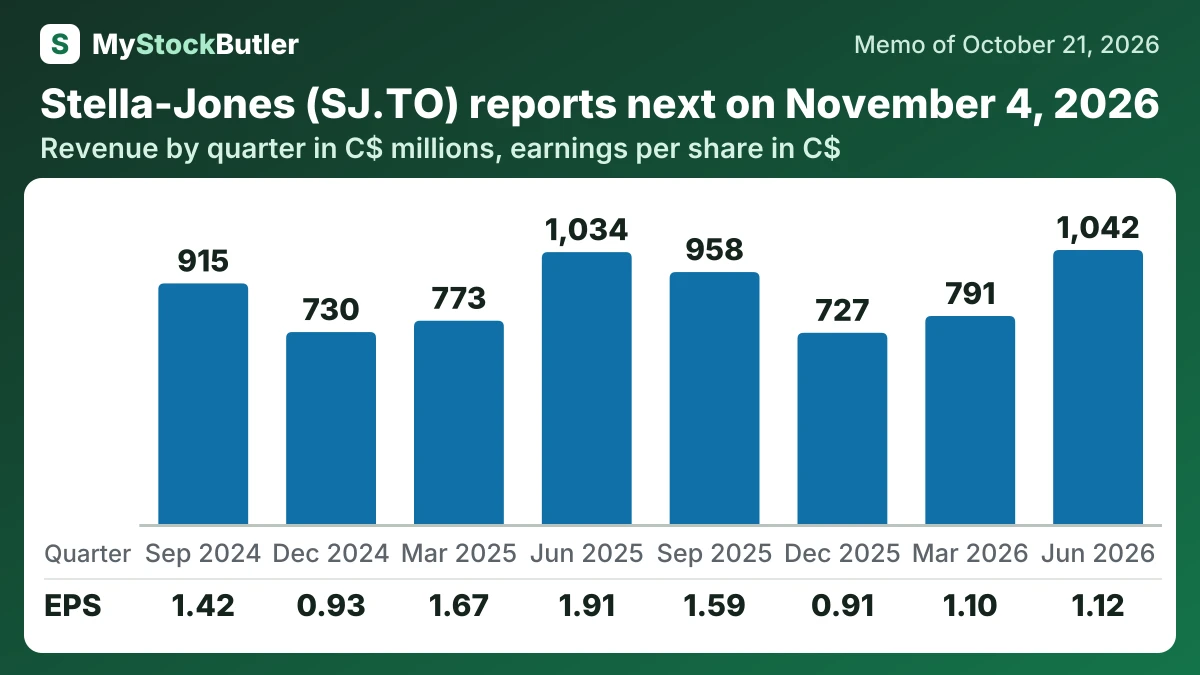
Q2 2026 showed stable sales but substantially weaker profit. Revenue was C$1,042 million against C$1,034 million in Q2 2025. Gross margin fell to 17.9% from 19.9%. Operating income fell to C$95 million from C$155 million, while net income fell to C$61 million from C$106 million. Diluted EPS fell to C$1.12 from C$1.91.
The company’s adjusted operating income was C$129 million in Q2 2026, and adjusted EBITDA was C$167 million. Adjusted EBITDA margin was 16.0%, down from 18.3% in Q2 2025. The railway impairment also signals excess capacity after a customer moved treatment in-house.
| Jun 2026 | Mar 2026 | Dec 2025 | Sep 2025 | Jun 2025 | Mar 2025 | Dec 2024 | Sep 2024 | |
|---|---|---|---|---|---|---|---|---|
| Revenue | 1,042 | 791 | 727 | 958 | 1,034 | 773 | 730 | 915 |
| Gross margin | 17.9% | 19.6% | 19.7% | 19.6% | 19.9% | 21.7% | 18.9% | 20.5% |
| Operating income | 95 | 97 | 83 | 135 | 155 | 143 | 81 | 130 |
| Net income | 61 | 60 | 50 | 88 | 106 | 93 | 52 | 80 |
| EPS, diluted | 1.12 | 1.10 | 0.91 | 1.59 | 1.91 | 1.67 | 0.93 | 1.42 |
What this means. Free cash flow is lower than cash from operations because this report also subtracts lease payments, not just capital spending.