Stella-Jones dividend
MyStockButler's October 2026 analysis: Stella-Jones’ forecast dividend rises from C$1.45 to C$1.69 per share. Stella-Jones generated C$374 million of real free cash flow in 2025, and its forecast uses a 20%–30% payout framework.
How much does Stella-Jones pay per share?
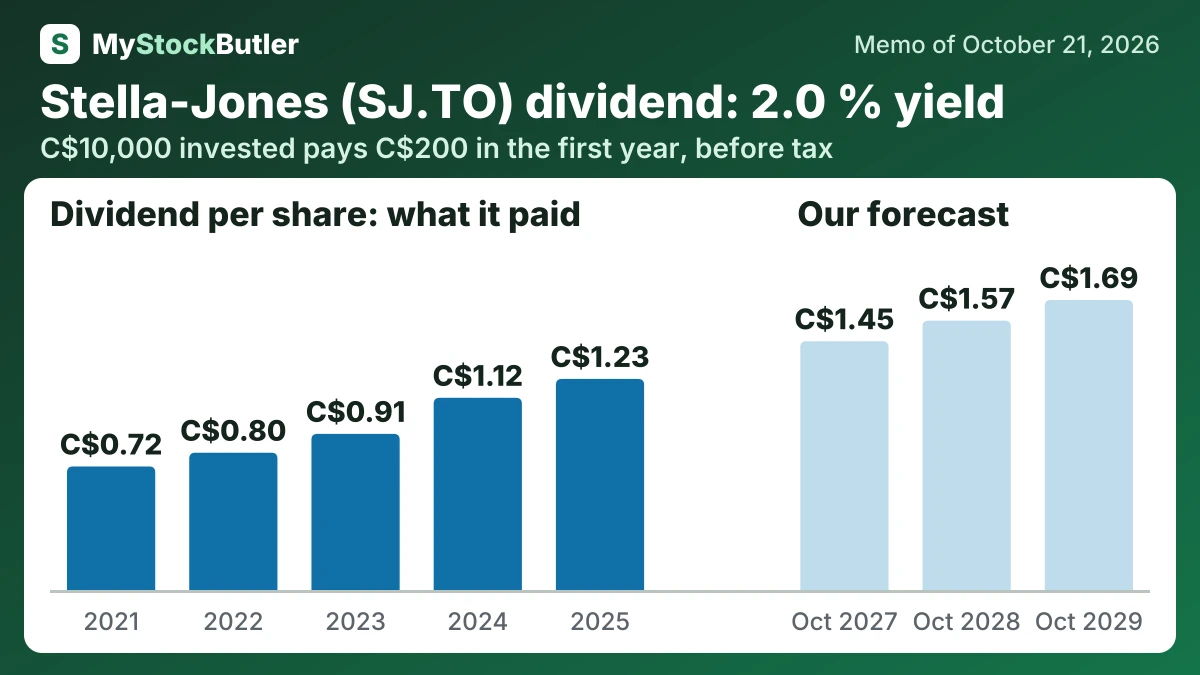
Dividends rise from C$1.45 to C$1.69 in the base case. The bear remains at C$1.36 before falling to C$1.24, while the bull rises from C$1.48 to C$1.94. The base reflects the rising dividend record and the 20%–30% payout framework, but the weaker quarter and discretionary board policy argue against the bull path.
| 2025 | 2024 | 2023 | 2022 | 2021 | |
|---|---|---|---|---|---|
| EPS, diluted | 6.09 | 5.66 | 5.62 | 3.93 | 3.49 |
| Real free cash flow per share | 6.75 | 3.55 | -1.91 | 1.79 | 2.52 |
| − Dividends paid, per share | 1.23 | 1.12 | 0.91 | 0.80 | 0.72 |
| = FCF not paid out, per share | 4.15 | 1.08 | 0.20 |
What this means. The company’s own free cash flow per share is higher than ours because it uses a different calculation that counts only maintenance spending rather than all equipment spending.
How much would Stella-Jones's dividend pay you?
C$10,000 invested in Stella-Jones at its 2.0% dividend yield (our report of October 21, 2026) pays C$200.00 in the first year, before tax. If its dividend per share keeps changing 14.3% a year, as it did from 2021 to 2025, and the dividends are reinvested, year 10 pays C$918.76, with C$4,687.09 received in all.
Before tax. Past dividend growth is not a promise. Information only, not investment advice.
Is Stella-Jones’ dividend covered by its cash?
That release can reflect timing rather than new economics: wood bought earlier can produce cash when shipped later without creating equivalent new earnings. Free cash flow also depends on the definition used. Stella-Jones spent C$103 million on capital and C$66 million on leases in 2025. On that basis, free cash flow was C$388 million. Subtracting C$14 million of stock compensation leaves C$374 million of economic, or “real,” free cash flow.
The 2026–2028 framework makes repurchases opportunistic around growth and leverage. Stella-Jones spent C$15 million on buybacks in the first quarter of 2026 and nothing in the second, an early sign that management can preserve cash when other uses are stronger.
| 2025 | 2024 | 2023 | 2022 | 2021 | |
|---|---|---|---|---|---|
| Free cash flow | 388 | 214 | -98 | 117 | 168 |
| − Dividends paid | 68 | 63 | 53 | 49 | 47 |
| − Share buybacks | 90 | 90 | 142 | 180 | 108 |
| = Free cash flow not paid out | 230 | 61 | 13 |
What this means. The company's own net debt is higher because it includes lease liabilities, while our figure does not.
What could change Stella-Jones’ dividend?
| October 2027 | October 2028 | October 2029 | |
|---|---|---|---|
| Earnings | 299 (242 / 326) | 359 (247 / 409) | 393 (257 / 457) |
| Shares (millions) | 53.94 (54.22 / 53.41) | 53.37 (53.93 / 52.39) | 52.86 (53.61 / 51.48) |
| Dividends per share | 1.45 (1.36 / 1.48) | 1.57 (1.36 / 1.70) | 1.69 (1.24 / 1.94) |
| Price to earnings | 14.00 (12.00 / 15.00) | 14.00 (11.00 / 16.00) | 14.00 (10.00 / 17.00) |
What is Stella-Jones’ dividend yield today?
The 10.4% free-cash-flow yield is attractive, but its durability is the real question. Stella-Jones deducts maintenance investment and lease payments from its cash-flow measure, but not all growth investment. A separately calculated “real” yield is 10.1%, while the dividend yield is 2.0%. Seasonal inventory releases can lift cash temporarily, so the useful test is whether cash remains strong after rebuilding inventory and funding expansion.