Rentokil Initial dividend
MyStockButler's October 2026 analysis: Rentokil Initial paid $304m in dividends in 2025, equal to 55.3% of free cash flow. Rentokil Initial generated $522m of real free cash flow after capital spending, leases and stock compensation, so cash covered the dividend.
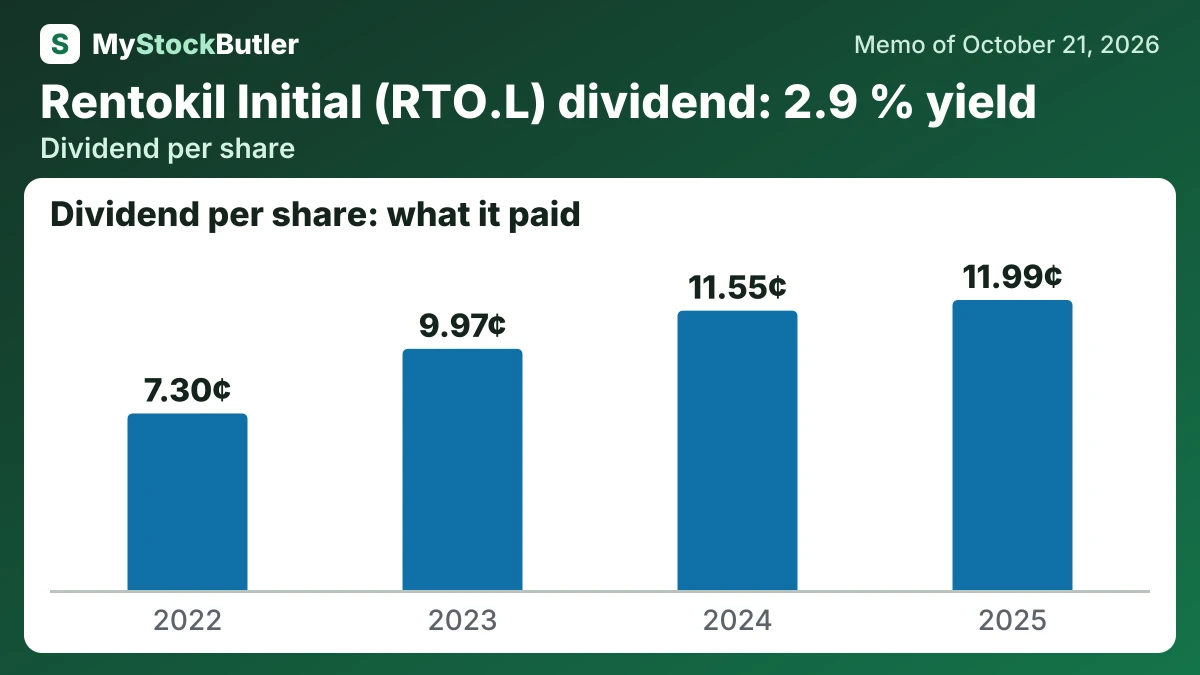
How much does Rentokil Initial pay per share?
The base dividend is £0.10 per share in each displayed window, reflecting roughly 3% annual growth before rounding. The bear case holds it at £0.09 because claims, transformation and debt costs constrain cash; the bull case rises to £0.11 as recovery supports the progressive policy. Dividends used 55.3% of free cash flow in 2025, which supports a freeze rather than an assumed cut in the downside case.
| 2025 | 2024 | 2023 | 2022 | 2021 | |
|---|---|---|---|---|---|
| − Paid to minority owners, per share | 0.00 | 0.00 | 0.00 | 0.00 | 0.00 |
| − Dividends paid, per share | 11.99 | 11.55 | 9.97 | 7.30 | |
| = FCF not paid out, per share | 9.70 | 5.54 | 9.77 |
What this means. The company's own free cash flow per share is higher because it adds asset-sale proceeds and other adjustments while our count does not.
Is Rentokil Initial's dividend covered by its cash?
Afterward, Rentokil bought fewer businesses and continued returning cash. Acquisition spending fell from $298m in 2023 to $121m in 2025. Dividends reached $304m in 2025, equal to 55.3% of free cash flow. Disposal receipts added $411m, giving the balance sheet another source of funds.
In 2025, cash from operations was $872m. Physical capital spending was $136m, and lease payments were $186m. After those deductions, analytical free cash flow was $550m. Deducting $28m of stock compensation, because shares issued to employees can dilute existing owners, gives “real free cash flow” of $522m. That label is an analytical convention, not a statutory measure.
| 2025 | 2024 | 2023 | 2022 | 2021 | |
|---|---|---|---|---|---|
| Free cash flow | 550 | 432 | 499 | ||
| − Dividends paid | 304 | 292 | 252 | 147 | |
| − Share buybacks | 0 | 0 | 0 | 0 | 0 |
| = Free cash flow not paid out | 246 | 140 | 247 | ||
| Paid to shareholders | 304 | 292 | 252 | 147 | |
| Paid out, % of free cash flow | 55.3% | 67.6% | 50.5% |
What this means. The company's own net debt is higher because it includes leases and debt-related contracts that our calculation leaves out.
What could change Rentokil Initial's dividend?
In 2028 and 2029, the decisive evidence will be cash generation, debt reduction and termite-related outflows. Stronger cash after investment would support dividends and a higher multiple. Higher borrowing costs, persistent claims or cash shortfalls would push both earnings and valuation toward the bear case.
| October 2027 | October 2028 | October 2029 | |
|---|---|---|---|
| Earnings | 584 (496 / 617) | 617 (509 / 675) | 652 (522 / 737) |
| Dividends per share | 0.10 (0.09 / 0.10) | 0.10 (0.09 / 0.10) | 0.10 (0.09 / 0.11) |
| Price to earnings | 14.00 (11.00 / 17.00) | 15.00 (10.00 / 19.00) | 16.00 (9.00 / 21.00) |
What is Rentokil Initial's dividend yield today?
At 314.90p on 21 October 2026, Rentokil Initial had an equity market value of £7,954.5 million. Its 13.7x next-12-month P/E means investors pay £13.70 for each £1 of forecast earnings. The dividend yield was 2.9% on that date, giving shareholders income while they wait.