Rollins stock forecast 2027–2029
MyStockButler's October 2026 analysis: Rollins's weighted scenario is nearly flat through October 2029. It hinges on repaired residential customer acquisition.
Where could Rollins's shares be by 2029?
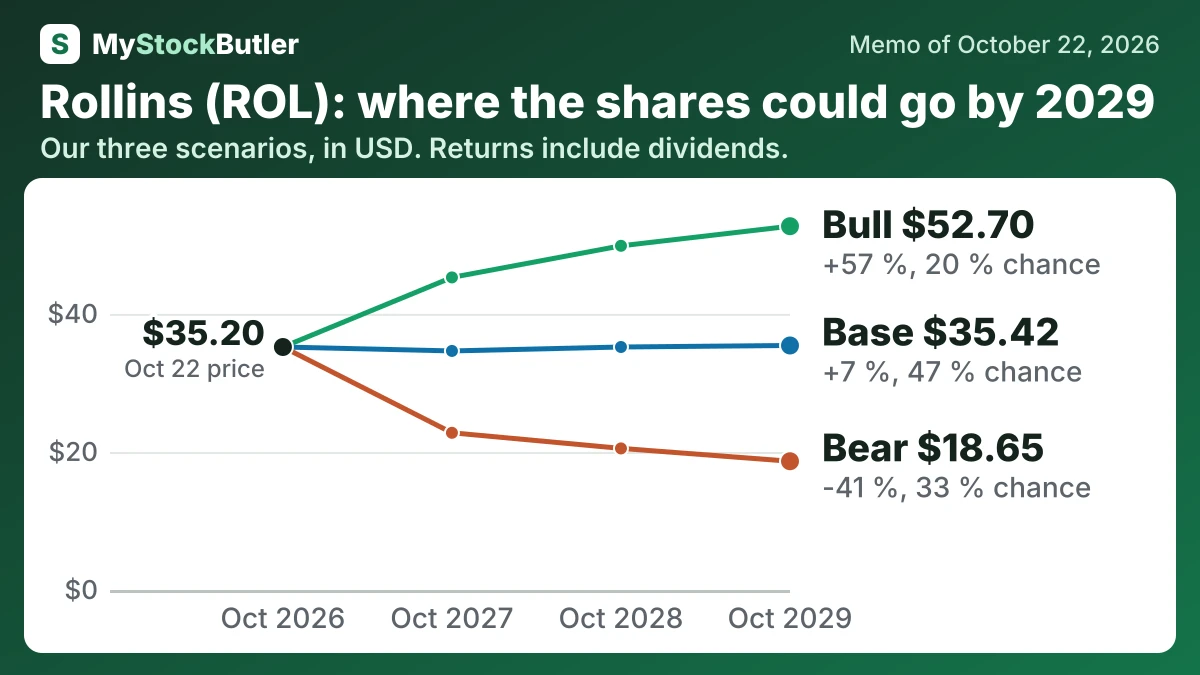
The first weighted point is $32.85 in October 2027. Including dividends, it is a 5% loss. The last is $33.34 in October 2029. Including dividends, it is a 1% gain. The forecast assigns 33% probability to bear and 47% to base; bull carries 20%.
| Case | Probability | October 2027 | October 2028 | October 2029 |
|---|---|---|---|---|
| Bear | 33 % | 22.77 (-33 %) | 20.51 (-38 %) | 18.65 (-41 %) |
| Base | 47 % | 34.63 (+0 %) | 35.20 (+4 %) | 35.42 (+7 %) |
| Bull | 20 % | 45.28 (+31 %) | 49.86 (+46 %) | 52.70 (+57 %) |
| Weighted | 100 % | 32.85 (-5 %) | 33.28 (-1 %) | 33.34 (+1 %) |
What has to go right or wrong for Rollins's forecast?
Fourth-quarter and full-year 2026 results will test residential leads, new customers and profitable recurring service, while management explains its 2027 expectations. By 2028, the bull case needs 7%–8% organic growth and better routes to lift margins. Acquired-customer retention, cash generation and selective repurchases decide whether Rollins earns its premium.
The bear case keeps residential leads weak while acquisitions mask slower core demand. Revenue grows, but costs absorb the gains; debt limits repurchases and confidence falls. The price reaches $22.77 in October 2027 and $18.65 in October 2029. Its probability is 33% because recent operating weakness, reduced guidance and rising net debt make the path credible.
How much real free cash flow does Rollins make?
Stock compensation shows the difference between accounting cash flow and economic cost. Rollins adds stock pay back because issuing shares requires no immediate cash, but employees still receive value. Treating that amount as a cost produces a more conservative “real free cash flow.”
| 2025 | 2024 | 2023 | 2022 | 2021 | |
|---|---|---|---|---|---|
| Cash from operations | 678,107 | 607,653 | 528,366 | 465,930 | 401,805 |
| − Capital spending | 28,086 | 27,572 | 32,465 | 30,628 | 27,194 |
| = Free cash flow | 650,021 | 580,081 | 495,901 | 435,302 | 374,611 |
| − Stock pay | 39,707 | 29,984 | 24,605 | 21,215 | 14,865 |
| = Real free cash flow | 610,314 | 550,097 | 471,296 | 414,087 | 359,746 |
What this means. Stock pay uses no cash today, but it gives employees part of the company, so we subtract its value to show what is truly left for shareholders.
What does an investor pay for Rollins today?
Free cash flow has a similar qualification. Rollins defines it as operating cash flow minus capital expenditure, so it excludes acquisitions. The 3.9% free cash flow yield therefore measures cash after normal investment, not cash after every way Rollins spends money. The dividend yield is 2.3%; it is a use of business cash, not an additional return to add to free cash flow.
| Today (Oct 22, 2026) | |
|---|---|
| Share price | 35.20 |
| Market value (calculated) | 16,826,022.4 |
| Enterprise value (calculated) | 17,424,121.4 |
| P/E, last 12 months (calculated) | 32.3x |
| P/E, next 12 months (calculated) | 27.7x |
| Free cash flow yield (calculated) | 3.9% |
What this means. Enterprise value is higher than market value because the company has more debt than cash, so buying the whole business would cost more than buying its shares.