RBI stock forecast 2027–2029 (QSR)
MyStockButler's October 2026 analysis: RBI’s probability-weighted price is $64.91 in October 2027, $65.57 in October 2028 and $69.21 in October 2029. It hinges on execution across brands, franchisees and debt.
Where could RBI’s shares go?
The probability-weighted price is $64.91 in October 2027, $65.57 in October 2028 and $69.21 in October 2029. Including dividends, those outcomes represent a loss of 4%, a gain of 1% and a gain of 10% from today’s $70.24. By October 2029, the bear case reaches $35.82 while the bull case reaches $112.77, showing that execution matters more than the central valuation.
The base case assumes RBI meets its comparable-sales and organic operating-income algorithm, moves toward 5% net restaurant growth and exits most Restaurant Holdings restaurants. The shares reach $69.17 first and $75.55 last. The 55% probability is highest because current momentum and the growth programme offset, but do not eliminate, the reporting drag and debt burden.
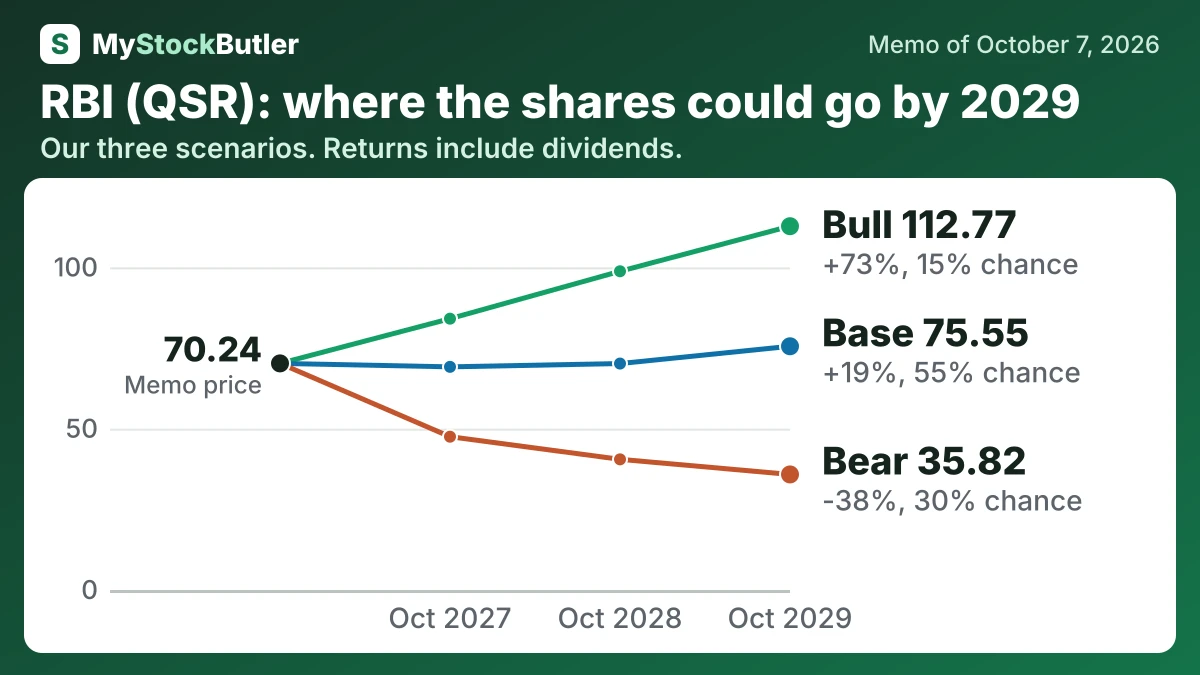
| Case | Probability | October 2027 | October 2028 | October 2029 |
|---|---|---|---|---|
| Bear | 30% | 47.52 (-29%) | 40.50 (-35%) | 35.82 (-38%) |
| Base | 55% | 69.17 (+2%) | 70.19 (+8%) | 75.55 (+19%) |
| Bull | 15% | 84.10 (+24%) | 98.80 (+49%) | 112.77 (+73%) |
| Weighted | 100% | 64.91 (-4%) | 65.57 (+1%) | 69.21 (+10%) |
What has to go right for RBI, and what could go wrong?
Revenue is the largest swing. The base path uses 4.5% growth in the first year and a decline of 8.0% in the second. It then returns to 4.5% and reaches 5.0%. The first estimate is close to consensus revenue of $9,859 million against $9,434 million previously; the subsequent fall models Restaurant Holdings transfers despite RBI’s growth algorithm. The bear path uses 3.0% and then -12.0%, followed by 1.5% and 2.5%, because Popeyes weakness and uncertain Burger King traffic would compound the transfer effect. The bull uses 5.5% and then -5.0%, followed by 7.0% and 7.0%, because Burger King, Popeyes and International growth would offset more of the lost company sales.
Margins rise gradually in the base case, from 17.8% to 18.2% and then 18.6% and 19.0%. The path reflects better royalty mix but keeps interest, taxes and input costs as constraints. The bear falls from 15.0% to 14.0%, 13.5% and 13.0%; the bull rises from 18.8% to 20.0%, 21.3% and 22.5%. The bull requires recurring operating improvement, not a one-time gain, while the bear reflects weak brands and debt service. The base stays below consensus margins, which reach about 18.9% in the first forecast year and 24.3% later.
| FY2026 | FY2027 | FY2028 | FY2029 | |
|---|---|---|---|---|
| Revenue growth | 4.5% (3.0% / 5.5%) | -8.0% (-12.0% / -5.0%) | 4.5% (1.5% / 7.0%) | 5.0% (2.5% / 7.0%) |
| Net margin | 17.8% (15.0% / 18.8%) | 18.2% (14.0% / 20.0%) | 18.6% (13.5% / 21.3%) | 19.0% (13.0% / 22.5%) |
| Earnings per share | 3.88 (3.21 / 4.14) | 3.70 (2.67 / 4.22) | 3.96 (2.60 / 4.85) | 4.27 (2.55 / 5.53) |
| Buybacks | 500 (400 / 500) | 500 (350 / 500) | 250 (0.00 / 500) | 300 (0.00 / 600) |
| Dividend per share | 2.60 (2.60 / 2.60) | 2.70 (2.60 / 2.73) | 2.81 (2.62 / 2.88) | 2.92 (2.65 / 3.05) |
How much cash does RBI really make?
RBI defines free cash flow as operating cash flow less property spending. First-half property spending was $109 million, leaving company-defined FCF of $648 million. But the company says this is not residual cash available for any purpose. Franchisee inducements, remodels, acquisitions, debt repayment and working capital still compete for cash.
| Year to Dec 2025 | Year to Dec 2024 | Year to Dec 2023 | Year to Dec 2022 | Year to Dec 2021 | |
|---|---|---|---|---|---|
| Cash from operations | 1,503 | 1,323 | 1,490 | 1,726 | |
| − Capital spending | 265 | 201 | 120 | 100 | 106 |
| = Free cash flow | 1,302 | 1,203 | 1,390 | 1,620 | |
| − Stock-based pay | 137 | 161 | 177 | ||
| = Real free cash flow (after stock pay) | 1,141 | 1,026 |