PSH dividend
MyStockButler's October 2026 analysis: PSH's annualised fiscal 2026 payment is $0.7348 per share, and its policy links dividends to NAV rather than simply to income received. The memo says free cash flow is a poor primary coverage measure for PSH, so cash, debt, distributions and buybacks must be read together.
How much does PSH pay its shareholders?
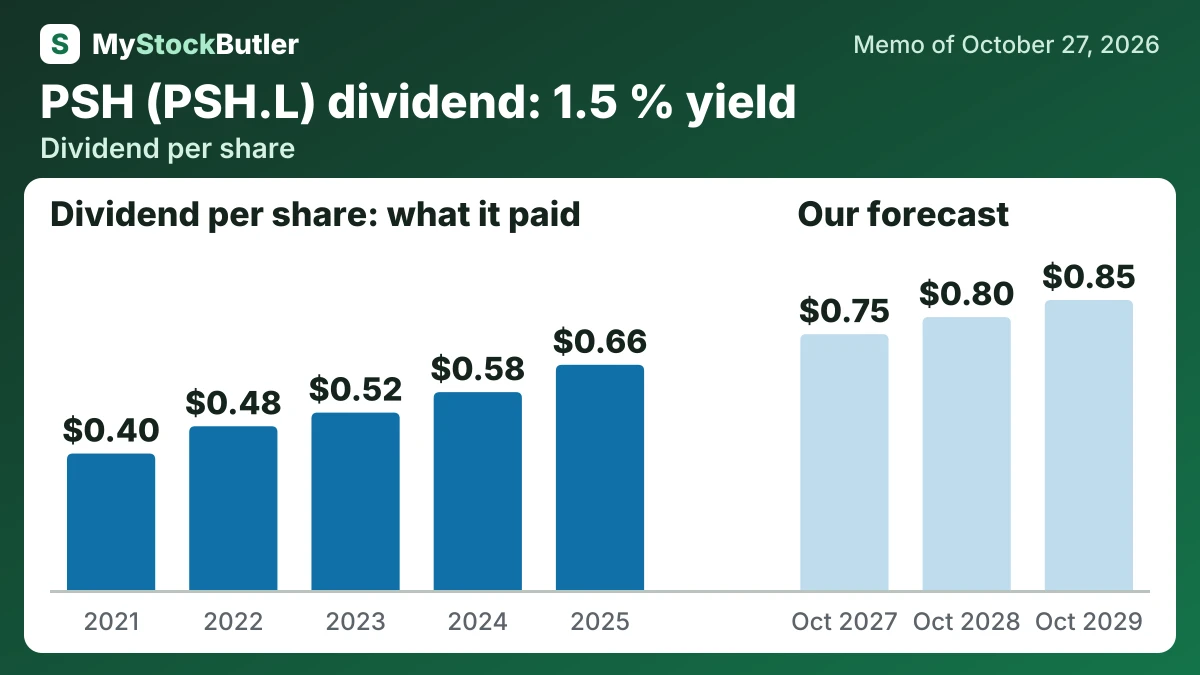
The base dividend is $0.75 per share in 2027 and $0.80 in 2028, reaching $0.85 in 2029. This is modest growth from the annualised fiscal 2026 payment of $0.7348 and follows a record of annual increases from 2021 through 2025. The bear path falls to $0.50 by 2029 as NAV weakness and cash needs force a cut; the bull path reaches $1.10 as NAV recovery lifts the formula-based payment.
| 2025 | 2024 | 2023 | 2022 | 2021 | |
|---|---|---|---|---|---|
| Book value per share | 85.32 | 71.11 | 65.04 | 51.76 | 57.30 |
| Book value per share, growth | 20.0% | 9.3% | 25.7% | -9.7% | 26.0% |
| − Dividends paid, per share | 0.66 | 0.58 | 0.52 | 0.48 | 0.40 |
| − Share buybacks, per share | 2.07 | 0.65 | 1.06 | 1.34 | 0.00 |
What this means. Share buybacks per share is not money paid to every shareholder; it is the company's total spending on buying its own shares divided by the number of shares.
Does PSH's cash cover its dividend?
Investment income also needs careful naming. Dividends and interest totalled $166.8 million in 2025, but “net investment income” after specified expenses was negative in every year from 2021 through 2025. The practical meaning is that capital appreciation, rather than cash income, must carry the overall return.
A fund uses cash to buy investments, pay fees, service debt, distribute dividends and meet derivative demands. Buying an investment changes the asset mix; it does not resemble a factory’s maintenance spending. That is why free cash flow and net debt to EBITDA are poor primary measures here.
| 2025 | 2024 | 2023 | 2022 | 2021 | |
|---|---|---|---|---|---|
| − Dividends paid | 118,118,040 | 107,166,682 | 98,781,277 | 93,271,012 | 79,650,896 |
| − Share buybacks | 371,125,605 | 119,623,243 | 199,956,134 | 262,423,586 | 0 |
| New shares sold | 0 | 0 | 0 | 0 | 0 |
What this means. The 2021 share buyback amount is zero because the small cash payment that year only settled leftover fractions of shares, rather than buying back shares.
What could change PSH's dividend?
PSH can reach 5061.38 GBp by October 2029 if NAV grows, buybacks support per-share value, refinancing is managed and the discount narrows. PSH reports monthly NAV and performance rather than earnings guidance. Its dividend policy is formula-guided, but the board can change or stop payments. Debt is limited by a 33.3% debt-to-capital bond covenant, falling to 25.0% after a specified key-person event.
| October 2027 | October 2028 | October 2029 | |
|---|---|---|---|
| Net asset value | 14,782 (12,046 / 15,870) | 16,011 (10,621 / 18,468) | 17,352 (9,353 / 21,589) |
| Shares (millions) | 170 (171 / 168) | 167 (170 / 164) | 165 (169 / 161) |
| Dividends per share | 0.75 (0.70 / 0.80) | 0.80 (0.60 / 0.95) | 0.85 (0.50 / 1.10) |
| Price to net asset value | 0.65 (0.50 / 0.75) | 0.68 (0.45 / 0.82) | 0.70 (0.40 / 0.90) |
What this means. The price to net asset value shows how much investors pay for each dollar of what the company owns after debts; a number below one means the shares cost less than that value.
What is PSH's dividend yield against its price?
NAV is the value of the assets minus liabilities, divided among the shares. PSH’s 30 September 2026 figures reported NAV of £57.79 and a share price of £36.60. That comparison implied a 36.7% discount. The dates and currencies must match, because both the portfolio and exchange rates can change.