Prudential earnings
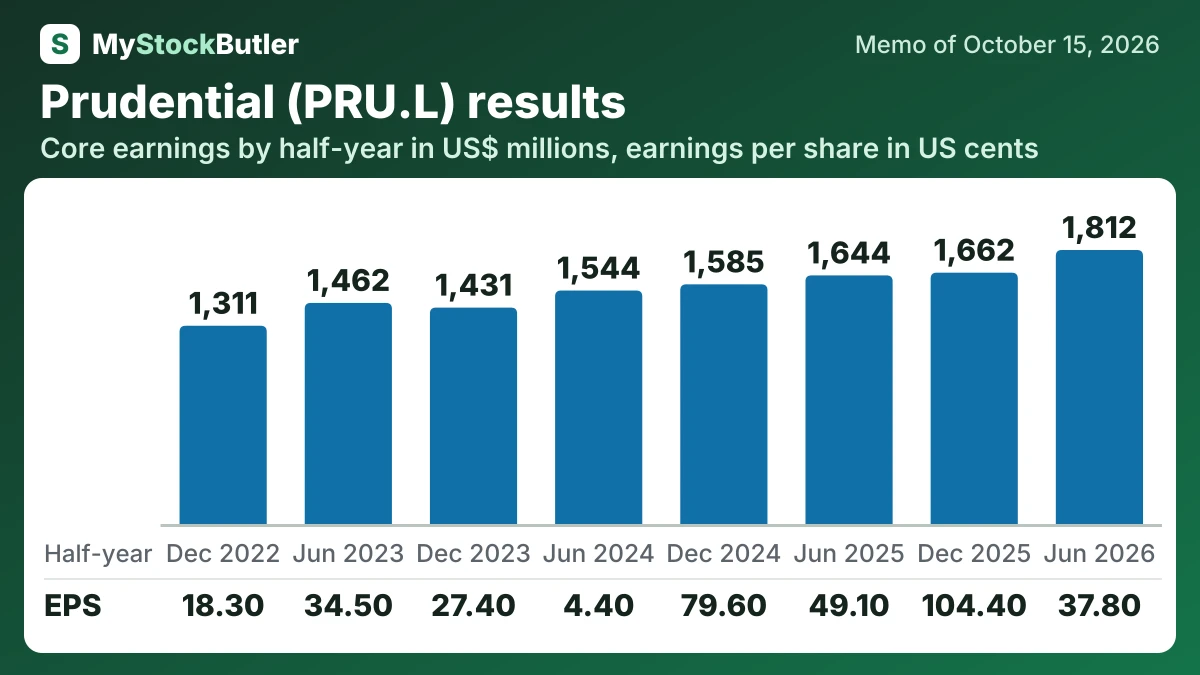
MyStockButler's October 2026 analysis: In the latest complete disclosed period, Prudential's core earnings rose 10.2% to $1,812 million, while net income fell 25.7% to $954 million and diluted EPS fell 23.0% to 37.80 cents. Watch whether second-half Chinese sales and capital generation support the promises still in force.
What has Prudential guided for 2026 and 2027?
Management targets annual compounded growth of 15.0%–20.0% in new-business profit from 2022 to 2027. It also targets US$4.4 billion of operating free surplus generation from existing insurance and asset-management business in 2027. This is capital released by policies already in force after claims, expenses and required capital are covered, so it can help finance new policies and shareholder payments.
For 2026, the growth hurdle is 10.0% for new-business profit, capital generation from existing business and adjusted operating earnings per share. Ordinary dividend per share must also grow by 10.0% in 2026 and 2027.
| Period covered | Low | High | Date given | |
|---|---|---|---|---|
| New business profit — compound annual growth rate (%) | 2022–2027 | 15.0% | 20.0% | 2026-08-27 |
| Operating free surplus generated from in-force insurance and asset management business (US$ billions) | 2027 | 4.4 | 2026-08-27 | |
| New business profit growth (%) | 2026 | 10.0% | 2026-08-27 | |
| Operating free surplus generated from in-force insurance and asset management business growth (%) | 2026 | 10.0% | 2026-08-27 | |
| Basic earnings per share based on adjusted operating profit growth (%) | 2026 | 10.0% | 2026-08-27 | |
| Ordinary dividend per share growth (%) | 2026 and 2027 | 10.0% | 2026-08-27 |
What this means. A target of 2.0 times 2022 means the amount should be twice what it was in 2022, not two dollars.
Has Prudential kept its past promises?
Prudential delivered against its 2025 growth guidance and reaffirmed its 2027 objectives, including 15–20% annual compound growth in new-business profit from 2022 and at least US$4.4 billion of operating free-surplus generation. The final promises remain to be proved through customer outcomes.
What is Prudential's trend across the last eight reported periods?
The latest complete disclosed period covers the six months to June 2026. Core earnings rose 10.2% to $1,812 million. Net income fell 25.7% to $954 million because interest-rate and other market movements produced a $626 million pretax loss. Diluted EPS also fell 23.0% to 37.80 cents. These signals are not contradictory: operating earnings were steadier than market-sensitive profit.
The eight reported periods show why one statutory comparison can mislead. H2 2025 included about $1,296 million of after-tax transaction gains. Removing those gains leaves H2 net income at about $1,398 million. The remaining result still contains market movements, but it gives a clearer view of the continuing business.
| 6 months to Jun 2026 | 6 months to Dec 2025 | 6 months to Jun 2025 | 6 months to Dec 2024 | 6 months to Jun 2024 | 6 months to Dec 2023 | 6 months to Jun 2023 | 6 months to Dec 2022 | |
|---|---|---|---|---|---|---|---|---|
| Core earnings (company's measure) | 1,812 | 1,662 | 1,644 | 1,585 | 1,544 | 1,431 | 1,462 | 1,311 |
| Net income | 954 | 2,694 | 1,284 | 2,165 | 120 | 757 | 944 | 501 |
| EPS, diluted | 37.80 | 104.40 | 49.10 | 79.60 | 4.40 | 27.40 | 34.50 | 18.30 |