Omnicom stock forecast 2027–2029
MyStockButler's October 2026 analysis: Omnicom's weighted case points to $129.49 by October 2029, with a 68% return including dividends. It hinges on client retention, synergy delivery and cash conversion.
Where could Omnicom's shares be by October 2029?
The forecast's probability-weighted case takes Omnicom from $82.89 today to $99.38 in October 2027 and $113.72 in October 2028. It reaches $129.49 in October 2029, for a probability-weighted return of 68% including dividends.
The weighted case is $99.38 in October 2027, a +24% return. It reaches $129.49 in October 2029, a +68% return. The bear case has 24% probability and the base case 56%; the bull case has 20%.
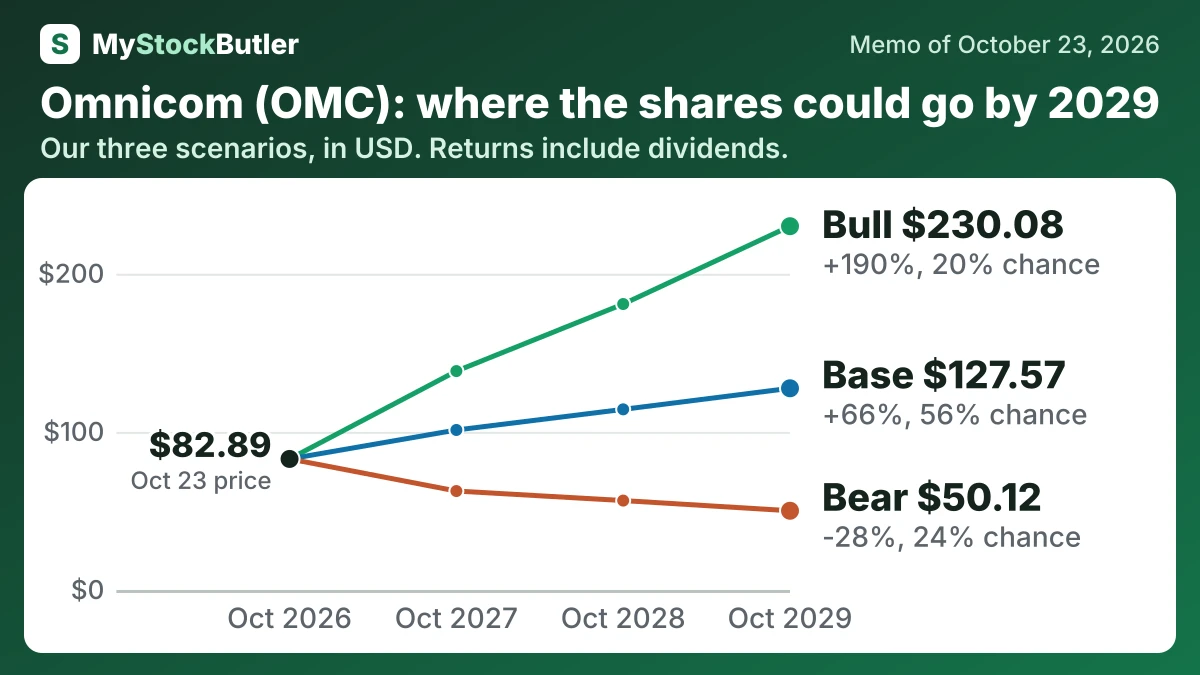
| Case | Probability | October 2027 | October 2028 | October 2029 |
|---|---|---|---|---|
| Bear | 24% | 62.58 (-21%) | 56.55 (-24%) | 50.12 (-28%) |
| Base | 56% | 101.20 (+26%) | 114.25 (+46%) | 127.57 (+66%) |
| Bull | 20% | 138.45 (+71%) | 180.85 (+126%) | 230.08 (+190%) |
| Weighted | 100% | 99.38 (+24%) | 113.72 (+45%) | 129.49 (+68%) |
What this means. The weighted row is the probability-based average of the three cases, not a promise that the shares will reach those prices.
What has to go right or wrong for Omnicom's stock forecast?
The December 31, 2026 results should show whether the $900 million savings target arrived and what integration spending accompanied it. By April 2027, the repurchase program must be assessed with cash and debt, not share-count reduction alone. By 2028, the $1.5 billion ambition must produce recurring profit without weakening client relationships. Omni matters only when adoption expands or renews work and improves cash generation. IPG savings must become durable earnings while clients, talent and cash hold.
The bear case uses earnings of $2,260M, $2,392M and $2,554M. It assumes revenue of $25,400M, $26,000M and $26,600M, with margins of 8.9%, 9.2% and 9.6%. Client losses and weak demand largely offset savings, while the $37.8M of nine-month operating cash flow after $2.3B of operating-capital use supports the downside risk.
| October 2027 | October 2028 | October 2029 | |
|---|---|---|---|
| Earnings | 3,198 (2,260 / 3,500) | 3,549 (2,392 / 4,000) | 3,899 (2,554 / 4,500) |
| Shares (millions) | 253 (253 / 253) | 248 (254 / 243) | 244 (255 / 235) |
| Dividends per share | 3.20 (3.20 / 3.20) | 3.30 (3.20 / 3.40) | 3.40 (3.20 / 3.60) |
| Price to earnings | 8.00 (7.00 / 10.00) | 8.00 (6.00 / 11.00) | 8.00 (5.00 / 12.00) |
How much cash does Omnicom really make?
Operating cash flow was $2.9 billion in 2025, while capital spending was $149.8 million. Conventional free cash flow therefore exceeded reported net income, and an additional analytical deduction treats stock compensation as a cost to shareholders.
| 2025 | 2024 | 2023 | 2022 | 2021 | |
|---|---|---|---|---|---|
| Cash from operations | 2,938.2 | 1,733.5 | 1,421.9 | 926.5 | 1,945.4 |
| − Capital spending | 149.8 | 140.6 | 78.4 | 78.2 | 665.8 |
| = Free cash flow | 2,788.4 | 1,592.9 | 1,343.5 | 848.3 | 1,279.6 |
| − Stock pay | 100.8 | 91.4 | 84.8 | 81.7 | 84.7 |
| = Real free cash flow | 2,687.6 | 1,501.5 | 1,258.7 | 766.6 | 1,194.9 |
| Real free cash flow, % of revenue | 15.6% | 9.6% | 8.6% | 5.4% | 8.4% |
What this means. The company's own free cash flow differs from ours because it ignores changes in money tied up in the business and does not subtract spending on equipment, while our count includes both.